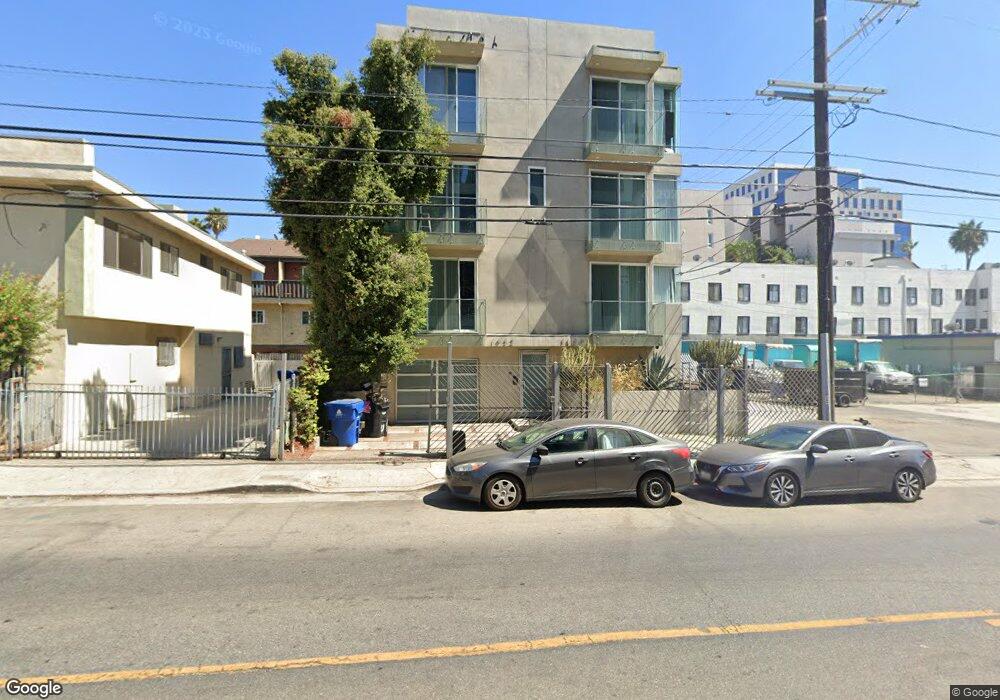
1520 N Bronson Ave Los Angeles, CA 90028
Hollywood NeighborhoodEstimated Value: $1,068,349 - $1,614,000
2
Beds
2
Baths
1,020
Sq Ft
$1,259/Sq Ft
Est. Value
About This Home
This home is located at 1520 N Bronson Ave, Los Angeles, CA 90028 and is currently estimated at $1,283,837, approximately $1,258 per square foot. 1520 N Bronson Ave is a home located in Los Angeles County with nearby schools including Grant Elementary School, Joseph Le Conte Middle School, and Helen Bernstein High School.
Ownership History
Date
Name
Owned For
Owner Type
Purchase Details
Closed on
Nov 19, 2012
Sold by
Vogel Kenneth A
Bought by
Bronson Avenue Properties Llc
Current Estimated Value
Purchase Details
Closed on
Mar 10, 2003
Sold by
Taurus Entertainment Co Inc
Bought by
Vogel Kenneth A
Purchase Details
Closed on
Dec 17, 2002
Sold by
Vogel Randi
Bought by
Vogel Kenneth A
Purchase Details
Closed on
Oct 18, 2000
Sold by
Mra Funding Corp
Bought by
Taurus Entertainment Company Inc
Purchase Details
Closed on
Apr 14, 1998
Sold by
Kgs Development Inc
Bought by
Mra Funding Corp
Purchase Details
Closed on
Apr 16, 1997
Sold by
Federal National Mortgage Association
Bought by
Kgs Development Inc
Purchase Details
Closed on
Mar 3, 1997
Sold by
Siripatanapaibul Chairoach and Federal National Mortgage Asso
Bought by
Federal National Mortgage Association
Create a Home Valuation Report for This Property
The Home Valuation Report is an in-depth analysis detailing your home's value as well as a comparison with similar homes in the area
Home Values in the Area
Average Home Value in this Area
Purchase History
| Date | Buyer | Sale Price | Title Company |
|---|---|---|---|
| Bronson Avenue Properties Llc | $50,000 | Accommodation | |
| Vogel Kenneth A | $97,000 | Commonwealth Land Title Co | |
| Vogel Kenneth A | -- | Commonwealth Land Title Co | |
| Taurus Entertainment Company Inc | $55,000 | United Title Company | |
| Mra Funding Corp | -- | -- | |
| Kgs Development Inc | $102,500 | Southland Title Company | |
| Federal National Mortgage Association | $92,500 | Stewart Title |
Source: Public Records
Tax History Compared to Growth
Tax History
| Year | Tax Paid | Tax Assessment Tax Assessment Total Assessment is a certain percentage of the fair market value that is determined by local assessors to be the total taxable value of land and additions on the property. | Land | Improvement |
|---|---|---|---|---|
| 2025 | $6,025 | $487,018 | $138,529 | $348,489 |
| 2024 | $6,025 | $477,469 | $135,813 | $341,656 |
| 2023 | $5,915 | $468,107 | $133,150 | $334,957 |
| 2022 | $5,648 | $458,930 | $130,540 | $328,390 |
| 2021 | $5,569 | $449,932 | $127,981 | $321,951 |
| 2019 | $5,405 | $436,588 | $124,186 | $312,402 |
| 2018 | $5,365 | $428,028 | $121,751 | $306,277 |
| 2017 | $5,215 | $419,636 | $119,364 | $300,272 |
| 2016 | $1,478 | $117,024 | $117,024 | $0 |
| 2015 | $1,457 | $115,267 | $115,267 | $0 |
| 2014 | $1,463 | $113,010 | $113,010 | $0 |
Source: Public Records
Map
Nearby Homes
- 5826 Carlton Way
- 1455 N Bronson Ave Unit 4
- 1458 Tamarind Ave
- 1449 N Bronson Ave
- 1539 Gordon St
- 1545 Gordon St
- 1514 La Baig Ave
- 5923 Carlton Way
- 6043 Selma Ave
- 1516 La Baig Ave
- 5947 Carlton Way
- 6008 Carlton Way
- 6001 Carlton Way Unit 105
- 6067 Harold Way
- 6040 Carlton Way
- 5913 Fountain Ave
- 5961 Fountain Ave
- 5851 La Mirada Ave
- 5633 Carlton Way Unit 503
- 5633 Carlton Way Unit 203
- 5852 Harold Way Unit F
- 5852 Harold Way Unit E
- 5852 Harold Way Unit D
- 5852 Harold Way Unit C
- 5852 Harold Way Unit B
- 5852 Harold Way Unit A
- 5846 Harold Way
- 5846 1/2 Harold Way
- 5849 W Sunset Blvd Unit 103
- 5849 W Sunset Blvd Unit 107
- 5849 W Sunset Blvd
- 5849 W Sunset Blvd
- 5849 W Sunset Blvd Unit 202A
- 5849 W Sunset Blvd Unit 114A
- 5849 W Sunset Blvd Unit 100A
- 5842 Harold Way Unit 404
- 5842 Harold Way Unit 403
- 5842 Harold Way Unit 402
- 5842 Harold Way Unit 401
- 5842 Harold Way Unit 304