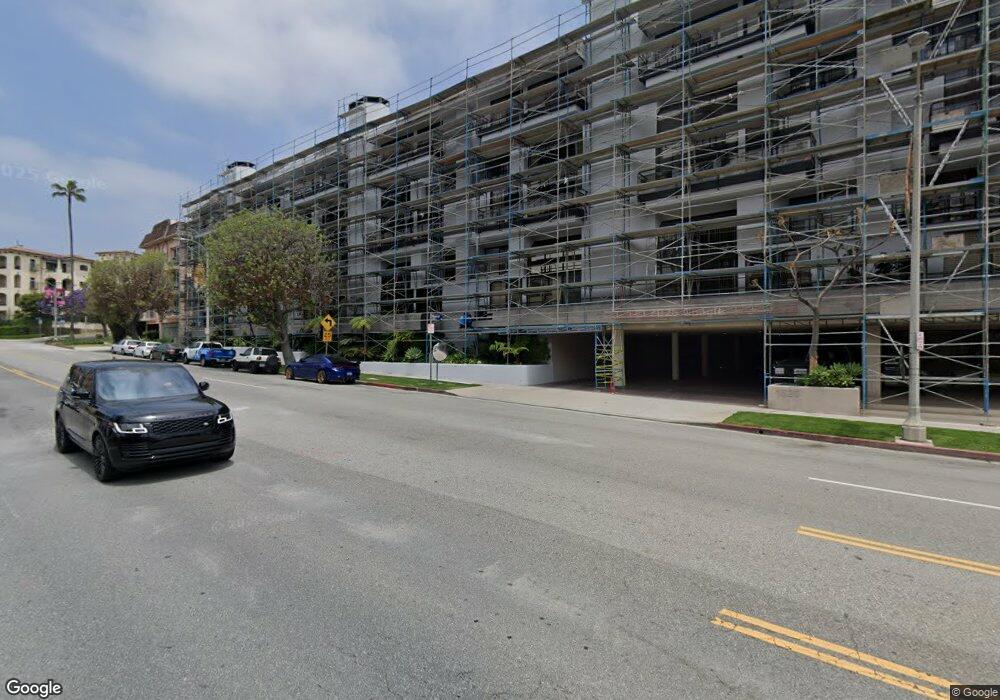
1520 S Bev Gln Blvd Unit 608 Los Angeles, CA 90024
Westwood NeighborhoodEstimated Value: $1,115,346 - $1,512,000
2
Beds
2
Baths
1,867
Sq Ft
$675/Sq Ft
Est. Value
About This Home
This home is located at 1520 S Bev Gln Blvd Unit 608, Los Angeles, CA 90024 and is currently estimated at $1,260,587, approximately $675 per square foot. 1520 S Bev Gln Blvd Unit 608 is a home located in Los Angeles County with nearby schools including Fairburn Avenue Elementary, Westwood Charter School, and Ralph Waldo Emerson Community Charter Middle School.
Ownership History
Date
Name
Owned For
Owner Type
Purchase Details
Closed on
Jun 9, 2015
Sold by
Reyhani Arash
Bought by
Reyhani Arash and Reyhani Edmond
Current Estimated Value
Purchase Details
Closed on
May 7, 2015
Sold by
Joseph Enterprises Llc
Bought by
Reyhani Arash
Purchase Details
Closed on
Oct 1, 2014
Sold by
Jonah 26 Llc
Bought by
Joseph Enterprises Llc
Purchase Details
Closed on
Feb 25, 2014
Sold by
Khojastegan Ebrahim
Bought by
Jonah 26
Purchase Details
Closed on
Feb 25, 2003
Sold by
Khojastegan Ebrahim and Khojastegan Vajiheh
Bought by
Khojastegan Ebrahim
Purchase Details
Closed on
Nov 18, 2002
Sold by
Sheridan Helen and Sheridan Helen Barbara
Bought by
Khokastegan Ebraham
Purchase Details
Closed on
Jun 21, 2002
Sold by
Sheridan Julie
Bought by
Sheridan Julie
Create a Home Valuation Report for This Property
The Home Valuation Report is an in-depth analysis detailing your home's value as well as a comparison with similar homes in the area
Home Values in the Area
Average Home Value in this Area
Purchase History
| Date | Buyer | Sale Price | Title Company |
|---|---|---|---|
| Reyhani Arash | -- | None Available | |
| Reyhani Arash | -- | None Available | |
| Joseph Enterprises Llc | -- | None Available | |
| Jonah 26 | $640,000 | Equity Title | |
| Khojastegan Ebrahim | -- | -- | |
| Khokastegan Ebraham | $520,000 | Equity Title Company | |
| Sheridan Julie | -- | -- |
Source: Public Records
Tax History Compared to Growth
Tax History
| Year | Tax Paid | Tax Assessment Tax Assessment Total Assessment is a certain percentage of the fair market value that is determined by local assessors to be the total taxable value of land and additions on the property. | Land | Improvement |
|---|---|---|---|---|
| 2025 | $10,212 | $859,312 | $360,551 | $498,761 |
| 2024 | $10,212 | $842,464 | $353,482 | $488,982 |
| 2023 | $10,015 | $825,946 | $346,551 | $479,395 |
| 2022 | $9,548 | $809,752 | $339,756 | $469,996 |
| 2021 | $9,422 | $793,876 | $333,095 | $460,781 |
| 2019 | $9,135 | $770,331 | $323,216 | $447,115 |
| 2018 | $9,105 | $755,228 | $316,879 | $438,349 |
| 2016 | $8,696 | $725,903 | $304,575 | $421,328 |
| 2015 | $7,757 | $640,000 | $340,000 | $300,000 |
| 2014 | -- | $614,362 | $364,483 | $249,879 |
Source: Public Records
Map
Nearby Homes
- 1617 S Beverly Glen Blvd Unit 303
- 1737 Warnall Ave
- 1519 Comstock Ave
- 1520 Comstock Ave
- 1360 S Beverly Glen Blvd
- 1361 S Beverly Glen Blvd
- 1355 Holmby Ave
- 1333 S Beverly Glen Blvd Unit 901
- 1333 S Beverly Glen Blvd Unit 904
- 1333 S Beverly Glen Blvd Unit 703
- 1333 S Beverly Glen Blvd Unit 1006
- 1333 S Beverly Glen Blvd Unit 402
- 10307 Missouri Ave Unit 301
- 10321 Rochester Ave
- 1301 S Beverly Glen Blvd
- 10509 Wilkins Ave
- 1501 Thayer Ave
- 1414 Club View Dr
- 10501 Eastborne Ave
- 1325 Thayer Ave
- 1520 S Beverly Glen Blvd Unit 501
- 1520 S Beverly Glen Blvd Unit 208
- 1520 S Beverly Glen Blvd Unit 402
- 1520 S Beverly Glen Blvd Unit 504
- 1520 S Beverly Glen Blvd Unit 107
- 1520 S Beverly Glen Blvd Unit 405
- 1520 S Beverly Glen Blvd Unit 403
- 1520 S Beverly Glen Blvd Unit 608
- 1520 S Beverly Glen Blvd Unit 408
- 1520 S Beverly Glen Blvd Unit 204
- 1520 S Beverly Glen Blvd Unit 101
- 1520 S Beverly Glen Blvd Unit 104
- 1520 S Beverly Glen Blvd Unit 106
- 1520 Beverly Glen Bl Unit 307
- 1520 S Beverly Glen Blvd Unit 207
- 1520 S Beverly Glen Blvd Unit 602
- 1520 S Beverly Glen Blvd Unit 603
- 1520 S Beverly Glen Blvd Unit 301
- 1520 S Beverly Glen Blvd Unit 205
- 1520 S Beverly Glen Blvd Unit 103