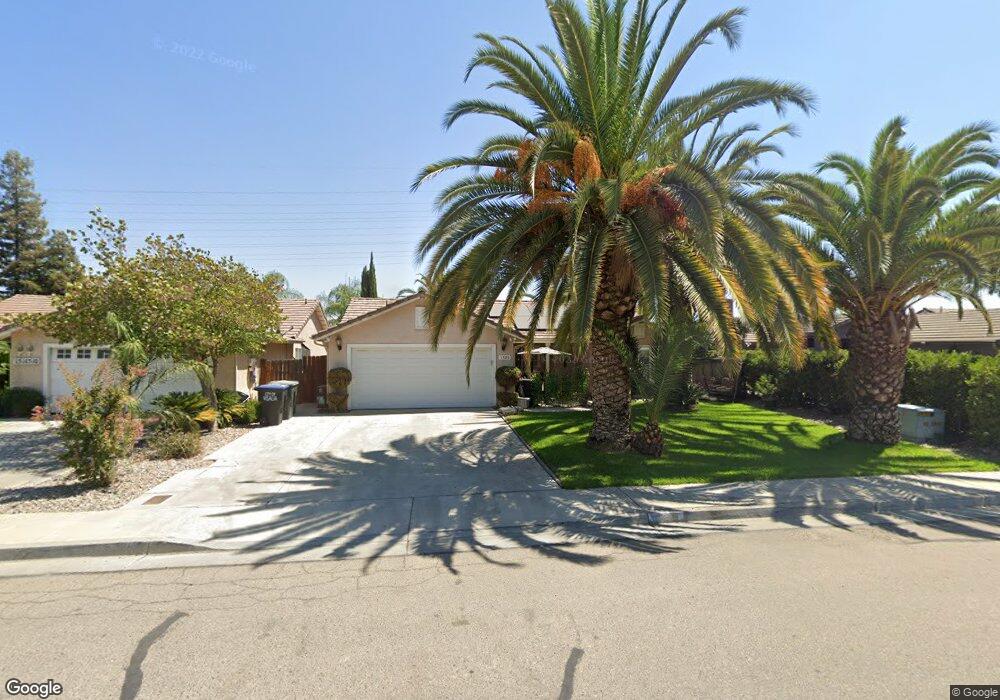
1520 S Rio Linda St Visalia, CA 93292
Estimated Value: $320,452 - $364,000
3
Beds
2
Baths
1,115
Sq Ft
$307/Sq Ft
Est. Value
About This Home
This home is located at 1520 S Rio Linda St, Visalia, CA 93292 and is currently estimated at $342,363, approximately $307 per square foot. 1520 S Rio Linda St is a home located in Tulare County with nearby schools including Mineral King Elementary School, Valley Oak Middle School, and Golden West High School.
Ownership History
Date
Name
Owned For
Owner Type
Purchase Details
Closed on
Jul 31, 2000
Sold by
Va
Bought by
Alcazar Homero and Alcazar Veronica
Current Estimated Value
Home Financials for this Owner
Home Financials are based on the most recent Mortgage that was taken out on this home.
Original Mortgage
$94,550
Outstanding Balance
$34,210
Interest Rate
8.19%
Mortgage Type
Seller Take Back
Estimated Equity
$308,153
Purchase Details
Closed on
Nov 30, 1999
Sold by
California Housing Finance Agency
Bought by
Hud
Purchase Details
Closed on
Nov 24, 1999
Sold by
Rodriguez George
Bought by
California Housing Finance Agency
Purchase Details
Closed on
Oct 17, 1994
Sold by
Kaufman & Broad Of Fresno Inc
Bought by
Rodriguez George
Home Financials for this Owner
Home Financials are based on the most recent Mortgage that was taken out on this home.
Original Mortgage
$95,140
Interest Rate
8.92%
Mortgage Type
Assumption
Create a Home Valuation Report for This Property
The Home Valuation Report is an in-depth analysis detailing your home's value as well as a comparison with similar homes in the area
Home Values in the Area
Average Home Value in this Area
Purchase History
| Date | Buyer | Sale Price | Title Company |
|---|---|---|---|
| Alcazar Homero | $95,000 | -- | |
| Hud | -- | Fidelity National Title Ins | |
| California Housing Finance Agency | $79,746 | -- | |
| Rodriguez George | $93,500 | First American Title Ins Co |
Source: Public Records
Mortgage History
| Date | Status | Borrower | Loan Amount |
|---|---|---|---|
| Open | Alcazar Homero | $94,550 | |
| Previous Owner | Rodriguez George | $95,140 |
Source: Public Records
Tax History Compared to Growth
Tax History
| Year | Tax Paid | Tax Assessment Tax Assessment Total Assessment is a certain percentage of the fair market value that is determined by local assessors to be the total taxable value of land and additions on the property. | Land | Improvement |
|---|---|---|---|---|
| 2025 | $1,558 | $143,156 | $45,210 | $97,946 |
| 2024 | $1,558 | $140,350 | $44,324 | $96,026 |
| 2023 | $1,517 | $137,599 | $43,455 | $94,144 |
| 2022 | $1,442 | $134,902 | $42,603 | $92,299 |
| 2021 | $1,442 | $132,257 | $41,768 | $90,489 |
| 2020 | $1,426 | $130,901 | $41,340 | $89,561 |
| 2019 | $1,391 | $128,334 | $40,529 | $87,805 |
| 2018 | $1,353 | $125,817 | $39,734 | $86,083 |
| 2017 | $1,334 | $123,350 | $38,955 | $84,395 |
| 2016 | $1,305 | $120,931 | $38,191 | $82,740 |
| 2015 | $1,251 | $119,114 | $37,617 | $81,497 |
| 2014 | $1,251 | $116,781 | $36,880 | $79,901 |
Source: Public Records
Map
Nearby Homes
- 1708 S Arroyo St
- 3931 E Hillcrest Ave
- 424 S McAuliff St
- 3735 E Cambridge Ct
- 3926 E Myrtle Ave
- 4132 E Kaweah Ave
- 4122 E Kaweah Ave
- 15061 Avenue 288
- 3541 E Laura Ct
- 804 S Simon St
- 3728 E Kaweah Ave
- 1701 S Crumal St
- 2242 S Manzanita Ct
- 3235 E Howard Ave
- 3320 E Laura Ave
- 2207 S Crumal St
- 2227 S Crumal St
- 3136 E Harter Ave
- 2017 S Velie St
- 1310 S Palm St
- 1520 S Rio Linda St Unit 1
- 1510 S Rio Linda St
- 1526 S Rio Linda St
- 1530 S Rio Linda St
- 1500 S Rio Linda St
- 4333 E Howard Ave
- 4334 E Feemster Ave
- 1534 S Rio Linda St
- 1440 S Rio Linda Ct
- 4323 E Howard Ave
- 4326 E Feemster Ave
- 1430 S Rio Linda Ct
- 1540 S Rio Linda St
- 1439 S Rio Linda Ct
- 4315 E Howard Ave
- 4335 E Feemster Ave
- 4316 E Feemster Ave
- 1416 S Rio Linda Ct
- 1544 S Rio Linda St
- 1429 S Rio Linda Ct