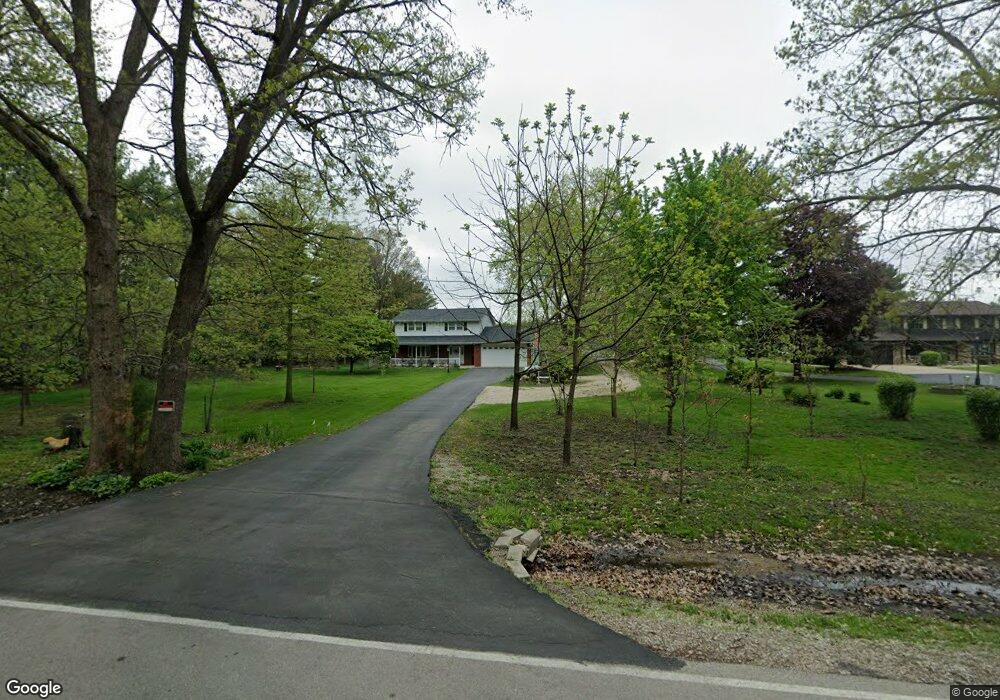
15200 Jughandle Rd Unit 1 Minooka, IL 60447
North Minooka NeighborhoodEstimated Value: $423,000 - $670,000
4
Beds
3
Baths
2,100
Sq Ft
$262/Sq Ft
Est. Value
About This Home
This home is located at 15200 Jughandle Rd Unit 1, Minooka, IL 60447 and is currently estimated at $550,423, approximately $262 per square foot. 15200 Jughandle Rd Unit 1 is a home located in Kendall County with nearby schools including Jones Elementary School, Minooka Junior High School, and Minooka Intermediate School.
Ownership History
Date
Name
Owned For
Owner Type
Purchase Details
Closed on
Mar 25, 2013
Sold by
Torres Jaime A and Iorris Shawn I
Bought by
Torres Jaime R and Iorres Shawn L
Current Estimated Value
Home Financials for this Owner
Home Financials are based on the most recent Mortgage that was taken out on this home.
Original Mortgage
$222,105
Outstanding Balance
$154,658
Interest Rate
3.25%
Mortgage Type
VA
Estimated Equity
$395,765
Purchase Details
Closed on
Jul 7, 2011
Sold by
Grote Leonard L and Grote Joyce A
Bought by
Torres Jaime A and Torres Shawn L
Home Financials for this Owner
Home Financials are based on the most recent Mortgage that was taken out on this home.
Original Mortgage
$227,812
Interest Rate
4.56%
Mortgage Type
VA
Purchase Details
Closed on
Aug 23, 2000
Sold by
Grote Leonard L and Grote Joyce A
Bought by
Grote Joyce A and Grote Leonard L
Create a Home Valuation Report for This Property
The Home Valuation Report is an in-depth analysis detailing your home's value as well as a comparison with similar homes in the area
Home Values in the Area
Average Home Value in this Area
Purchase History
| Date | Buyer | Sale Price | Title Company |
|---|---|---|---|
| Torres Jaime R | -- | National Title Solutions Inc | |
| Torres Jaime A | $250,000 | First American | |
| Grote Joyce A | -- | -- |
Source: Public Records
Mortgage History
| Date | Status | Borrower | Loan Amount |
|---|---|---|---|
| Open | Torres Jaime R | $222,105 | |
| Closed | Torres Jaime A | $227,812 |
Source: Public Records
Tax History Compared to Growth
Tax History
| Year | Tax Paid | Tax Assessment Tax Assessment Total Assessment is a certain percentage of the fair market value that is determined by local assessors to be the total taxable value of land and additions on the property. | Land | Improvement |
|---|---|---|---|---|
| 2024 | $11,422 | $152,440 | $21,728 | $130,712 |
| 2023 | $9,705 | $137,536 | $20,693 | $116,843 |
| 2022 | $9,705 | $127,486 | $18,293 | $109,193 |
| 2021 | $9,440 | $121,216 | $18,572 | $102,644 |
| 2020 | $8,800 | $110,553 | $20,356 | $90,197 |
| 2019 | $8,649 | $105,989 | $19,516 | $86,473 |
| 2018 | $8,208 | $101,582 | $19,516 | $82,066 |
| 2017 | $8,075 | $96,091 | $18,436 | $77,655 |
| 2016 | $7,521 | $89,315 | $18,208 | $71,107 |
| 2015 | $7,574 | $89,315 | $18,208 | $71,107 |
| 2014 | -- | $82,176 | $18,208 | $63,968 |
| 2013 | -- | $82,176 | $18,208 | $63,968 |
Source: Public Records
Map
Nearby Homes
- 1133 Coneflower Ct
- 2041 Isabella Ln
- 2033 Isabella
- 194 acres W Holt Rd
- Lot 1 Minooka Ridge & Jones Rd
- 814 Daniel Dr
- 819 Daniel Dr
- 1419 Kettleson Dr
- 8102 Wood River St
- 8010 Wood River St
- 409 Rockfish St
- 603 Briarcliff Dr
- 0 County Line Rd
- 00 County Line Rd
- 8508 Sawyer Ct
- 8513 Sawyer Ct
- 911 Bluebell Cir
- 8304 Coop Ave
- 8413 Eva Ave
- 1045 Heron Cir
- 15170 Jughandle Rd
- 15240 Jughandle Rd
- 15130 Jughandle Rd
- 15280 Jughandle Rd Unit 1
- 15100 Jughandle Rd
- 15320 Jughandle Rd Unit 1
- 15205 Jughandle Rd
- 15070 Jughandle Rd
- 15004 Jughandle Rd
- 15405 Jughandle Rd
- 14970 Jughandle Rd
- 2259 Bell Rd Unit G
- 2259 Bell Rd Unit G
- 2259 Bell Rd Unit A
- 2259 Bell Rd Unit 2
- 2259 Bell Rd Unit C
- 2259 Bell Rd Unit D
- 2259 Bell Rd
- 14925 Jughandle Rd
- 2325 Bell Rd