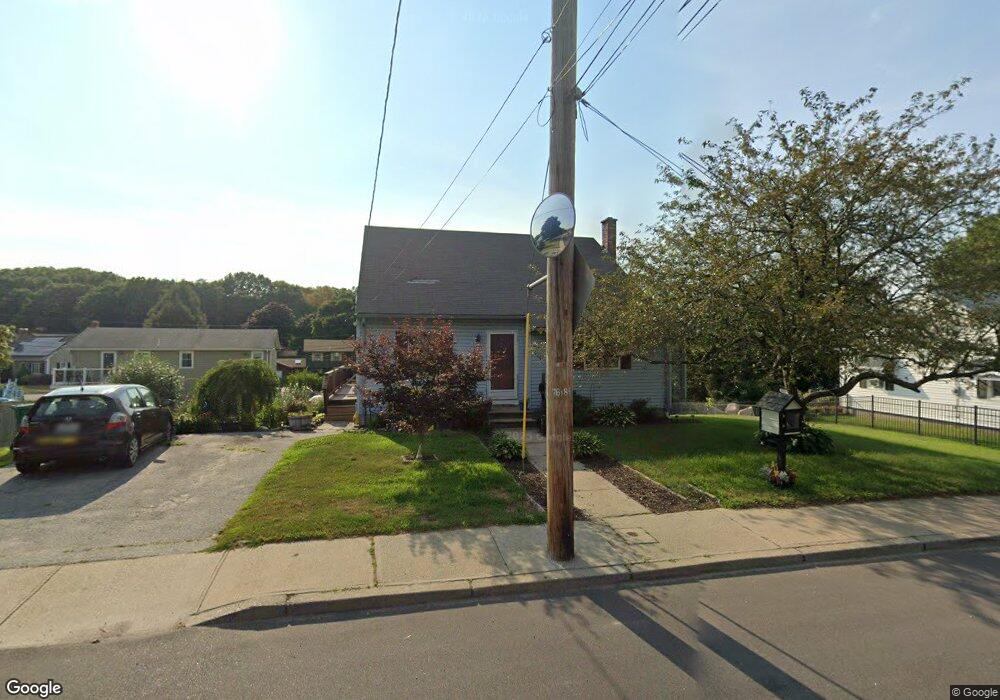
1521 Mendon Rd Woonsocket, RI 02895
East Woonsocket NeighborhoodEstimated Value: $395,000 - $477,000
3
Beds
2
Baths
1,216
Sq Ft
$346/Sq Ft
Est. Value
About This Home
This home is located at 1521 Mendon Rd, Woonsocket, RI 02895 and is currently estimated at $420,132, approximately $345 per square foot. 1521 Mendon Rd is a home located in Providence County with nearby schools including Woonsocket High School and Good Shepherd Catholic School.
Ownership History
Date
Name
Owned For
Owner Type
Purchase Details
Closed on
Apr 7, 2023
Sold by
Gabriele Carol A
Bought by
Henderson Cristen A
Current Estimated Value
Purchase Details
Closed on
Sep 28, 1993
Sold by
Ryan Jeanne E
Bought by
Dalpe Marc R and Dalpe Rhonda
Home Financials for this Owner
Home Financials are based on the most recent Mortgage that was taken out on this home.
Original Mortgage
$101,600
Interest Rate
7.1%
Mortgage Type
Purchase Money Mortgage
Create a Home Valuation Report for This Property
The Home Valuation Report is an in-depth analysis detailing your home's value as well as a comparison with similar homes in the area
Home Values in the Area
Average Home Value in this Area
Purchase History
| Date | Buyer | Sale Price | Title Company |
|---|---|---|---|
| Henderson Cristen A | -- | None Available | |
| Henderson Cristen A | -- | None Available | |
| Dalpe Marc R | $107,000 | -- | |
| Dalpe Marc R | $107,000 | -- |
Source: Public Records
Mortgage History
| Date | Status | Borrower | Loan Amount |
|---|---|---|---|
| Previous Owner | Dalpe Marc R | $85,000 | |
| Previous Owner | Dalpe Marc R | $101,600 |
Source: Public Records
Tax History
| Year | Tax Paid | Tax Assessment Tax Assessment Total Assessment is a certain percentage of the fair market value that is determined by local assessors to be the total taxable value of land and additions on the property. | Land | Improvement |
|---|---|---|---|---|
| 2025 | $4,089 | $364,100 | $110,800 | $253,300 |
| 2024 | $4,028 | $277,000 | $98,300 | $178,700 |
| 2023 | $3,872 | $277,000 | $98,300 | $178,700 |
| 2022 | $3,872 | $277,000 | $98,300 | $178,700 |
| 2021 | $4,496 | $189,300 | $65,300 | $124,000 |
| 2020 | $4,543 | $189,300 | $65,300 | $124,000 |
| 2018 | $4,558 | $189,300 | $65,300 | $124,000 |
| 2017 | $4,130 | $137,200 | $48,300 | $88,900 |
| 2016 | $4,368 | $137,200 | $48,300 | $88,900 |
| 2015 | $5,019 | $137,200 | $48,300 | $88,900 |
| 2014 | $3,557 | $141,400 | $53,100 | $88,300 |
Source: Public Records
Map
Nearby Homes
Your Personal Tour Guide
Ask me questions while you tour the home.