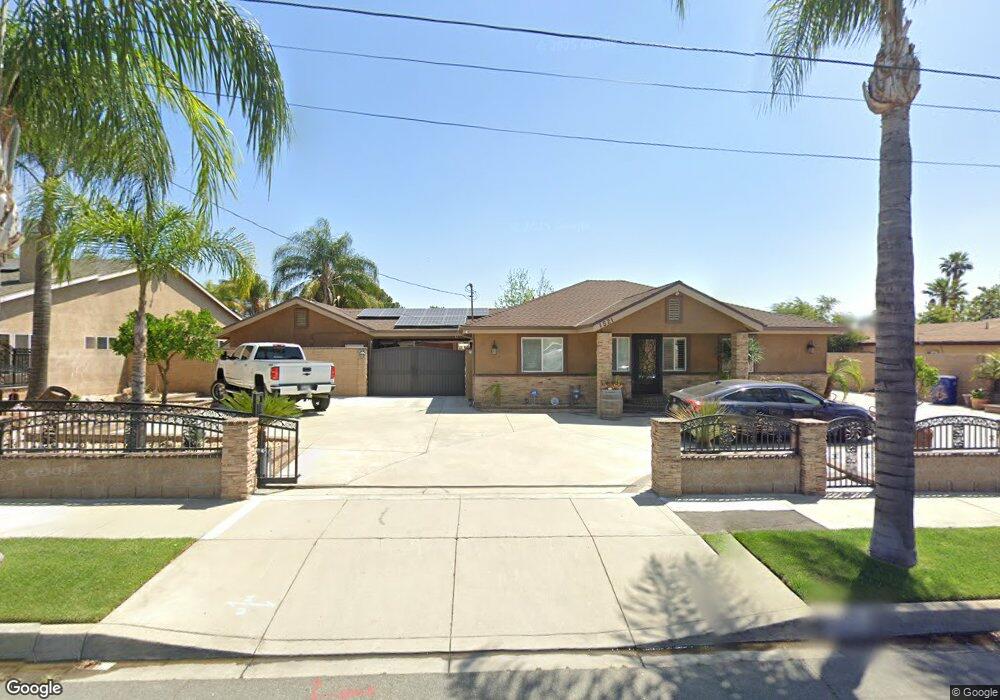
1521 S San Antonio Ave Ontario, CA 91762
Downtown Ontario NeighborhoodEstimated Value: $705,000 - $761,000
3
Beds
1
Bath
1,512
Sq Ft
$485/Sq Ft
Est. Value
About This Home
This home is located at 1521 S San Antonio Ave, Ontario, CA 91762 and is currently estimated at $733,846, approximately $485 per square foot. 1521 S San Antonio Ave is a home located in San Bernardino County with nearby schools including Richard Haynes Elementary, Oaks Middle, and Ontario High School.
Ownership History
Date
Name
Owned For
Owner Type
Purchase Details
Closed on
Mar 6, 2017
Sold by
Huizar Baudelio M
Bought by
Huizar Baudelio M and Huizar Sandra
Current Estimated Value
Purchase Details
Closed on
Nov 30, 2001
Sold by
Street Michael B
Bought by
Huizar Baudelio M and Huizar Ofelia
Home Financials for this Owner
Home Financials are based on the most recent Mortgage that was taken out on this home.
Original Mortgage
$157,528
Interest Rate
6.78%
Mortgage Type
FHA
Purchase Details
Closed on
May 17, 2000
Sold by
Washington Mutual Bank Fa
Bought by
Street Michael B
Purchase Details
Closed on
Apr 12, 2000
Sold by
Leach Edward D
Bought by
Washington Mutual Bank
Purchase Details
Closed on
Jun 25, 1999
Sold by
Leach Edward D
Bought by
Leach Edward D and Leach Archie E
Purchase Details
Closed on
Mar 25, 1996
Sold by
Leach Edward D
Bought by
Leach Edward D
Home Financials for this Owner
Home Financials are based on the most recent Mortgage that was taken out on this home.
Original Mortgage
$80,000
Interest Rate
6.98%
Create a Home Valuation Report for This Property
The Home Valuation Report is an in-depth analysis detailing your home's value as well as a comparison with similar homes in the area
Home Values in the Area
Average Home Value in this Area
Purchase History
| Date | Buyer | Sale Price | Title Company |
|---|---|---|---|
| Huizar Baudelio M | -- | Ticor Title | |
| Huizar Baudelio M | $160,000 | Chicago Title Co | |
| Street Michael B | $90,000 | Stewart Title Company | |
| Washington Mutual Bank | $97,000 | American Title | |
| Leach Edward D | -- | -- | |
| Leach Edward D | -- | First Southwestern Title Co |
Source: Public Records
Mortgage History
| Date | Status | Borrower | Loan Amount |
|---|---|---|---|
| Previous Owner | Huizar Baudelio M | $157,528 | |
| Previous Owner | Leach Edward D | $80,000 |
Source: Public Records
Tax History Compared to Growth
Tax History
| Year | Tax Paid | Tax Assessment Tax Assessment Total Assessment is a certain percentage of the fair market value that is determined by local assessors to be the total taxable value of land and additions on the property. | Land | Improvement |
|---|---|---|---|---|
| 2025 | $5,128 | $484,320 | $145,074 | $339,246 |
| 2024 | $5,128 | $474,823 | $142,229 | $332,594 |
| 2023 | $4,982 | $465,513 | $139,440 | $326,073 |
| 2022 | $4,915 | $456,385 | $136,706 | $319,679 |
| 2021 | $4,541 | $416,436 | $134,025 | $282,411 |
| 2020 | $4,014 | $371,423 | $132,651 | $238,772 |
| 2019 | $3,978 | $364,140 | $130,050 | $234,090 |
| 2018 | $3,922 | $357,000 | $127,500 | $229,500 |
| 2017 | $3,704 | $203,663 | $82,738 | $120,925 |
| 2016 | $3,774 | $199,670 | $81,116 | $118,554 |
| 2015 | $2,213 | $196,671 | $79,898 | $116,773 |
| 2014 | $2,879 | $192,819 | $78,333 | $114,486 |
Source: Public Records
Map
Nearby Homes
- 1546 Redwood Ave
- 1620 S Cypress Ave
- 4251 S Grasly Paseo
- 559 W Belmont St
- 653 W Belmont St
- 550 W Belmont St
- 646 W Belmont St
- 1849 S San Antonio Ave
- 1420 S Euclid Ave Unit A & B
- 1214 S Cypress Ave Unit G
- 754 W Belmont St
- 1216 S Cypress Ave Unit E
- 410 W Maitland St
- 1209 S Palmetto Ave Unit C
- 1949 S Palm Place
- 2022 S San Antonio Ave
- 1031 S Palmetto Ave Unit N9
- 1031 S Palmetto Ave Unit W8
- 1031 S Palmetto Ave Unit II3
- 1031 S Palmetto Ave Unit N1
- 1515 S San Antonio Ave
- 1533 S San Antonio Ave
- 606 Yucca St
- 1541 S San Antonio Ave
- 613 Yucca St
- 612 Yucca St
- 541 W Elm St
- 538 W Locust St
- 612 Zenia Ct
- 617 Yucca St
- 560 W Locust St
- 552 W Locust St
- 616 Yucca St
- 613 Eucalyptus St
- 544 W Locust St
- 616 Zenia Ct
- 529 W Elm St
- 623 Yucca St
- 617 Eucalyptus St
- 622 Yucca St