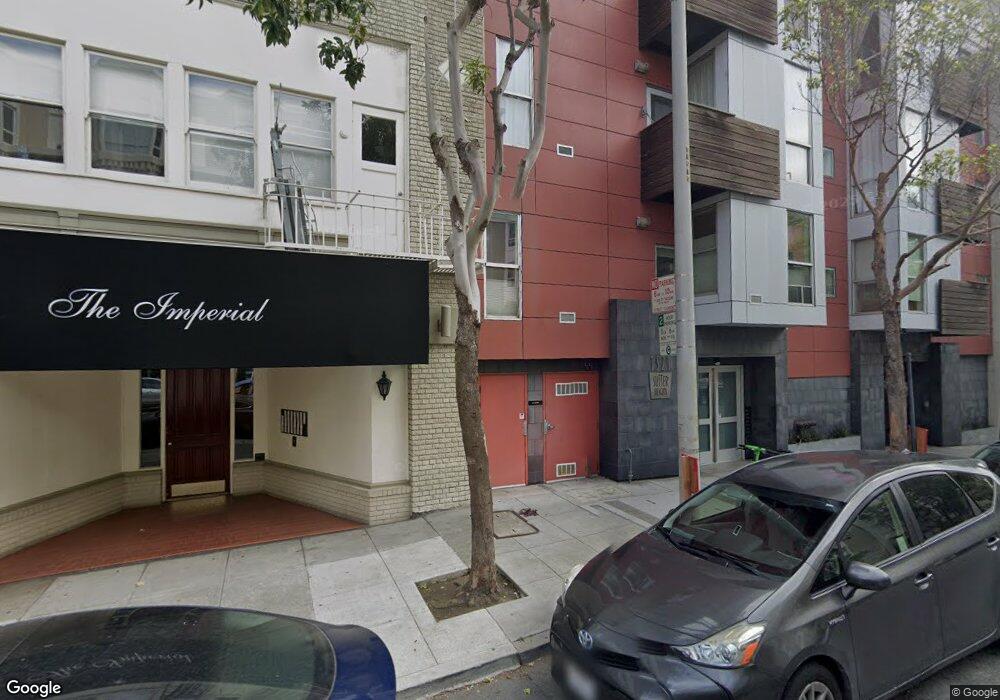
1521 Sutter St Unit 507 San Francisco, CA 94109
Lower Pacific Heights NeighborhoodEstimated Value: $806,000 - $1,008,000
1
Bed
2
Baths
799
Sq Ft
$1,096/Sq Ft
Est. Value
About This Home
This home is located at 1521 Sutter St Unit 507, San Francisco, CA 94109 and is currently estimated at $875,368, approximately $1,095 per square foot. 1521 Sutter St Unit 507 is a home located in San Francisco County with nearby schools including Sherman Elementary, Marina Middle School, and KIPP San Francisco Bay Academy.
Ownership History
Date
Name
Owned For
Owner Type
Purchase Details
Closed on
Jul 23, 2014
Sold by
Lee Dae S and Lee Hyon H
Bought by
The Dae Sok & Hyon Hui Lee Trust and Lee Hyon H
Current Estimated Value
Purchase Details
Closed on
Apr 28, 2014
Sold by
Conley James J
Bought by
Lee Dae S and Lee Hyon H
Home Financials for this Owner
Home Financials are based on the most recent Mortgage that was taken out on this home.
Original Mortgage
$405,000
Outstanding Balance
$308,079
Interest Rate
4.28%
Mortgage Type
New Conventional
Estimated Equity
$567,289
Purchase Details
Closed on
Nov 4, 2009
Sold by
Rodan Llc
Bought by
Conley James J
Home Financials for this Owner
Home Financials are based on the most recent Mortgage that was taken out on this home.
Original Mortgage
$497,600
Interest Rate
4.92%
Mortgage Type
New Conventional
Create a Home Valuation Report for This Property
The Home Valuation Report is an in-depth analysis detailing your home's value as well as a comparison with similar homes in the area
Home Values in the Area
Average Home Value in this Area
Purchase History
| Date | Buyer | Sale Price | Title Company |
|---|---|---|---|
| The Dae Sok & Hyon Hui Lee Trust | -- | None Available | |
| Lee Dae S | $850,000 | First American Title Company | |
| Conley James J | $622,000 | First American Title Company |
Source: Public Records
Mortgage History
| Date | Status | Borrower | Loan Amount |
|---|---|---|---|
| Open | Lee Dae S | $405,000 | |
| Previous Owner | Conley James J | $497,600 |
Source: Public Records
Tax History Compared to Growth
Tax History
| Year | Tax Paid | Tax Assessment Tax Assessment Total Assessment is a certain percentage of the fair market value that is determined by local assessors to be the total taxable value of land and additions on the property. | Land | Improvement |
|---|---|---|---|---|
| 2025 | $9,710 | $1,041,974 | $520,987 | $520,987 |
| 2024 | $9,710 | $824,000 | $412,000 | $412,000 |
| 2023 | $10,754 | $909,000 | $454,500 | $454,500 |
| 2022 | $10,734 | $906,000 | $453,000 | $453,000 |
| 2021 | $10,463 | $881,000 | $440,500 | $440,500 |
| 2020 | $11,463 | $952,756 | $476,378 | $476,378 |
| 2019 | $11,069 | $934,076 | $467,038 | $467,038 |
| 2018 | $10,697 | $915,762 | $457,881 | $457,881 |
| 2017 | $10,571 | $897,806 | $448,903 | $448,903 |
| 2016 | $10,393 | $880,202 | $440,101 | $440,101 |
| 2015 | $10,267 | $866,982 | $433,491 | $433,491 |
| 2014 | $8,047 | $654,958 | $327,479 | $327,479 |
Source: Public Records
Map
Nearby Homes
- 1388 Gough St Unit 1001
- 1483 Sutter St Unit 1204
- 1483 Sutter St Unit 405
- 1855-1857 Pine St
- 333 Austin St
- 1450 Franklin St Unit 902
- 1523 Franklin St Unit PH8
- 1705 Gough St
- 1200 Gough St Unit 14D
- 1700 Gough St Unit 308
- 66 Cleary Ct Unit 508
- 1 Daniel Burnham Ct Unit 816
- 1 Daniel Burnham Ct Unit 1610
- 1 Daniel Burnham Ct Unit 303
- 1 Daniel Burnham Ct Unit 101
- 1 Daniel Burnham Ct Unit 617
- 75 Western Shore Ln Unit 1
- 15 Western Shore Ln Unit 2
- 1800 Gough St Unit 7
- 1688 Pine St Unit 101
- 1521 Sutter St Unit 404
- 1521 Sutter St Unit 506
- 1521 Sutter St Unit 505
- 1521 Sutter St Unit 504
- 1521 Sutter St Unit 503
- 1521 Sutter St Unit 502
- 1521 Sutter St Unit 501
- 1521 Sutter St Unit 407
- 1521 Sutter St Unit 406
- 1521 Sutter St Unit 405
- 1521 Sutter St Unit 403
- 1521 Sutter St Unit 402
- 1521 Sutter St Unit 307
- 1521 Sutter St Unit 306
- 1521 Sutter St Unit 303
- 1521 Sutter St Unit 302
- 1521 Sutter St Unit 301
- 1521 Sutter St Unit 207
- 1521 Sutter St Unit 206
- 1521 Sutter St Unit 204