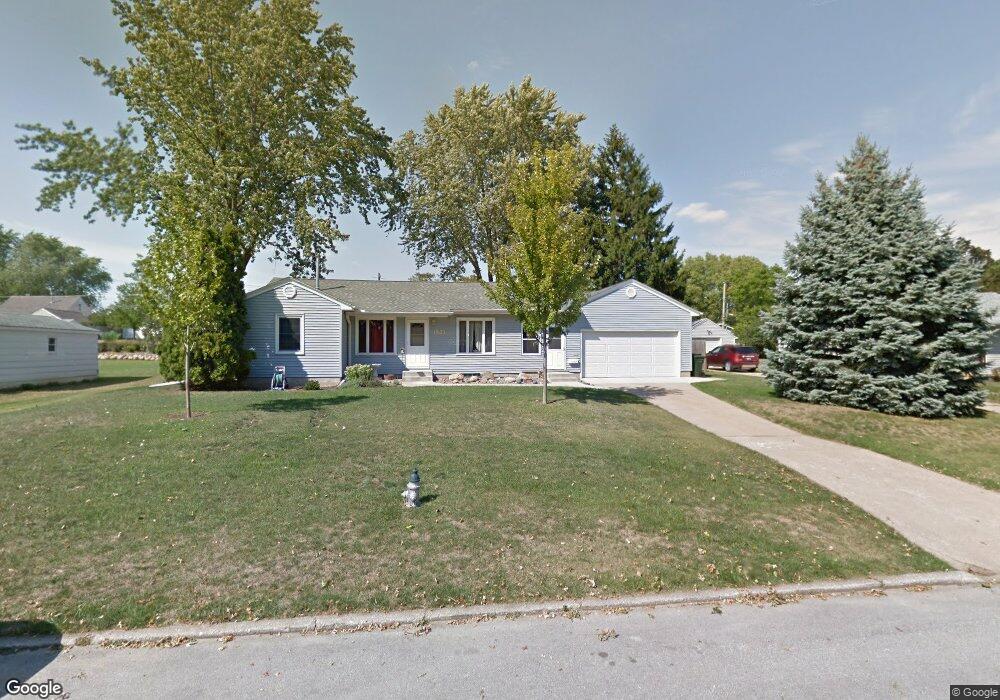
1521 W 3rd St Cedar Falls, IA 50613
Estimated Value: $144,000 - $214,000
2
Beds
2
Baths
960
Sq Ft
$200/Sq Ft
Est. Value
About This Home
This home is located at 1521 W 3rd St, Cedar Falls, IA 50613 and is currently estimated at $192,454, approximately $200 per square foot. 1521 W 3rd St is a home located in Black Hawk County with nearby schools including Lincoln Elementary School, Holmes Junior High School, and Cedar Falls High School.
Ownership History
Date
Name
Owned For
Owner Type
Purchase Details
Closed on
Oct 1, 2015
Sold by
Burns Christy M and Burns Adam W
Bought by
Selck Christy M and Selck Adam W
Current Estimated Value
Purchase Details
Closed on
Aug 18, 2005
Sold by
Primacy Closing Corp
Bought by
Burns Christy M
Home Financials for this Owner
Home Financials are based on the most recent Mortgage that was taken out on this home.
Original Mortgage
$78,000
Outstanding Balance
$41,342
Interest Rate
5.8%
Mortgage Type
New Conventional
Estimated Equity
$151,112
Purchase Details
Closed on
Aug 3, 2005
Sold by
Boyer Richard K and Boyer Kristi K
Bought by
Primacy Closing Corp
Home Financials for this Owner
Home Financials are based on the most recent Mortgage that was taken out on this home.
Original Mortgage
$78,000
Outstanding Balance
$41,342
Interest Rate
5.8%
Mortgage Type
New Conventional
Estimated Equity
$151,112
Create a Home Valuation Report for This Property
The Home Valuation Report is an in-depth analysis detailing your home's value as well as a comparison with similar homes in the area
Home Values in the Area
Average Home Value in this Area
Purchase History
| Date | Buyer | Sale Price | Title Company |
|---|---|---|---|
| Selck Christy M | -- | None Available | |
| Burns Christy M | $128,000 | None Available | |
| Primacy Closing Corp | $128,000 | None Available |
Source: Public Records
Mortgage History
| Date | Status | Borrower | Loan Amount |
|---|---|---|---|
| Open | Burns Christy M | $78,000 |
Source: Public Records
Tax History Compared to Growth
Tax History
| Year | Tax Paid | Tax Assessment Tax Assessment Total Assessment is a certain percentage of the fair market value that is determined by local assessors to be the total taxable value of land and additions on the property. | Land | Improvement |
|---|---|---|---|---|
| 2025 | $2,694 | $206,760 | $66,530 | $140,230 |
| 2024 | $2,694 | $177,630 | $42,770 | $134,860 |
| 2023 | $2,532 | $177,630 | $42,770 | $134,860 |
| 2022 | $2,532 | $146,070 | $42,770 | $103,300 |
| 2021 | $2,562 | $146,070 | $42,770 | $103,300 |
| 2020 | $2,288 | $134,190 | $30,890 | $103,300 |
| 2019 | $2,288 | $134,190 | $30,890 | $103,300 |
| 2018 | $2,318 | $134,190 | $30,890 | $103,300 |
| 2017 | $2,318 | $134,190 | $30,890 | $103,300 |
| 2016 | $2,218 | $134,190 | $30,890 | $103,300 |
| 2015 | $2,218 | $134,190 | $30,890 | $103,300 |
| 2014 | $2,158 | $129,490 | $30,890 | $98,600 |
Source: Public Records
Map
Nearby Homes
- 423 Chateau Ct
- 127 N Genevieve St
- 214 N Francis St
- 1212 W 7th St
- 330 N Francis St
- 1025 W 8th St
- 921 W 7th St
- 908 W 1st St
- 1014 W 8th St
- 813 W 2nd St
- 2201 W 8th St
- 716 W 2nd St
- 803 College St
- 915 W 9th St
- 538 Fireside Dr
- 502 Oak Park Blvd
- 816 College St
- 1104 Warwick Dr
- 2126 Oxford Ln
- 1616 S Forest Rd