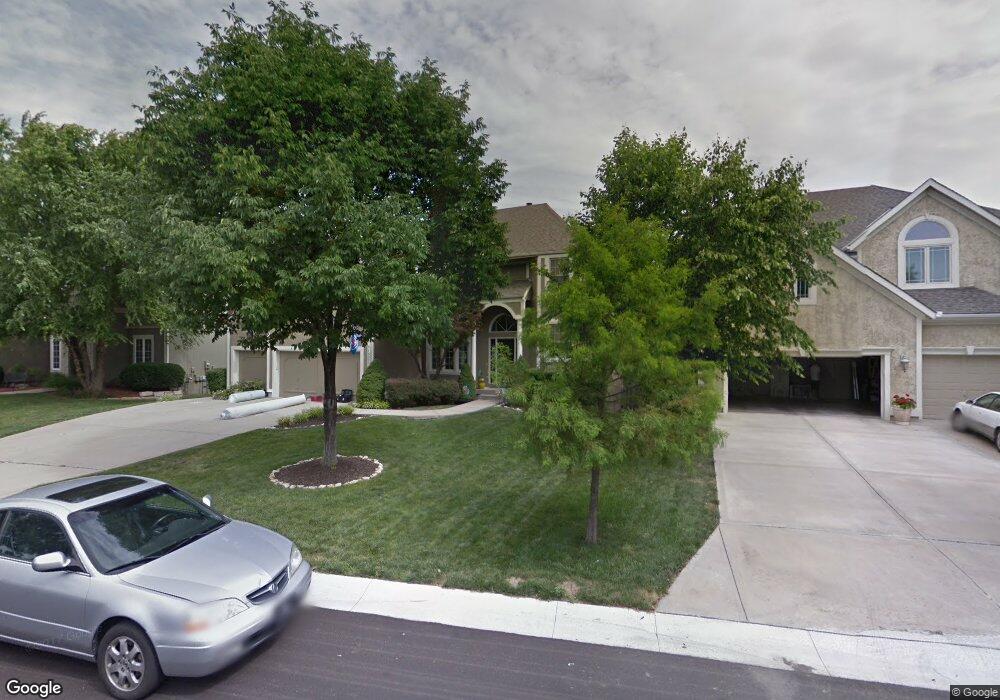
15220 W 86th St Lenexa, KS 66219
Estimated Value: $513,000 - $595,000
4
Beds
5
Baths
3,029
Sq Ft
$180/Sq Ft
Est. Value
About This Home
This home is located at 15220 W 86th St, Lenexa, KS 66219 and is currently estimated at $544,912, approximately $179 per square foot. 15220 W 86th St is a home located in Johnson County with nearby schools including Christa McAuliffe Elementary School, Westridge Middle School, and Shawnee Mission West High School.
Ownership History
Date
Name
Owned For
Owner Type
Purchase Details
Closed on
Apr 26, 2011
Sold by
Deutsche Bank National Trust Company
Bought by
Brown Sean M and Brown Alissa D
Current Estimated Value
Home Financials for this Owner
Home Financials are based on the most recent Mortgage that was taken out on this home.
Original Mortgage
$208,080
Outstanding Balance
$144,806
Interest Rate
4.91%
Mortgage Type
New Conventional
Estimated Equity
$400,106
Purchase Details
Closed on
Feb 14, 2011
Sold by
Wollen Andrew and Wollen Parthena T
Bought by
Deutsche Bank National Trust Company
Purchase Details
Closed on
Feb 22, 2005
Sold by
Kenney Calvin R and Kenney Mary L
Bought by
Wollen Andrew T and Wollen Parthena T
Home Financials for this Owner
Home Financials are based on the most recent Mortgage that was taken out on this home.
Original Mortgage
$274,000
Interest Rate
5.75%
Mortgage Type
Adjustable Rate Mortgage/ARM
Create a Home Valuation Report for This Property
The Home Valuation Report is an in-depth analysis detailing your home's value as well as a comparison with similar homes in the area
Home Values in the Area
Average Home Value in this Area
Purchase History
| Date | Buyer | Sale Price | Title Company |
|---|---|---|---|
| Brown Sean M | -- | Mokan Title Services Llc | |
| Deutsche Bank National Trust Company | $304,606 | None Available | |
| Wollen Andrew T | -- | Homestead Title |
Source: Public Records
Mortgage History
| Date | Status | Borrower | Loan Amount |
|---|---|---|---|
| Open | Brown Sean M | $208,080 | |
| Previous Owner | Wollen Andrew T | $274,000 |
Source: Public Records
Tax History Compared to Growth
Tax History
| Year | Tax Paid | Tax Assessment Tax Assessment Total Assessment is a certain percentage of the fair market value that is determined by local assessors to be the total taxable value of land and additions on the property. | Land | Improvement |
|---|---|---|---|---|
| 2024 | $7,124 | $64,147 | $13,064 | $51,083 |
| 2023 | $6,476 | $57,569 | $10,889 | $46,680 |
| 2022 | $5,910 | $52,509 | $9,900 | $42,609 |
| 2021 | $5,752 | $48,645 | $9,900 | $38,745 |
| 2020 | $5,375 | $44,988 | $9,900 | $35,088 |
| 2019 | $5,460 | $45,701 | $8,602 | $37,099 |
| 2018 | $5,375 | $44,597 | $7,823 | $36,774 |
| 2017 | $5,036 | $40,480 | $7,823 | $32,657 |
| 2016 | $5,231 | $41,561 | $7,823 | $33,738 |
| 2015 | $4,790 | $38,295 | $7,823 | $30,472 |
| 2013 | -- | $31,291 | $7,823 | $23,468 |
Source: Public Records
Map
Nearby Homes
- 8616 Baska Ct
- 8403 Swarner Dr
- 15611 W 86th St
- 15322 W 83rd Terrace
- 14915 W 84th Terrace
- 15529 W 83rd Terrace
- 15710 W 84th Terrace
- 15322 W 83rd St
- 14828 W 83rd Place
- 14620 W 84th St
- 14424 W 84th Terrace
- 15615 W 81st St
- 8946 Country Hill Ct
- 8919 Greenway Ln
- 8641 Greenwood Ln
- 8033 Hall St
- 15920 W 91st Terrace
- 9124 Constance St
- 9131 Darnell St
- 15320 W 92nd Place
- 15214 W 86th St
- 15226 W 86th St
- 15213 W 85th St
- 15208 W 86th St
- 15219 W 85th St
- 15207 W 85th St
- 15300 W 86th St
- 15116 W 86th St
- 8622 Baska Ct
- 8610 Baska Ct
- 15303 W 85th St
- 15204 W 85th St
- 15110 W 86th St
- 15309 W 85th St
- 15218 W 85th St
- 15212 W 85th St
- 15312 W 86th St
- 8628 Baska Ct
- 15224 W 85th St
- 15104 W 86th St