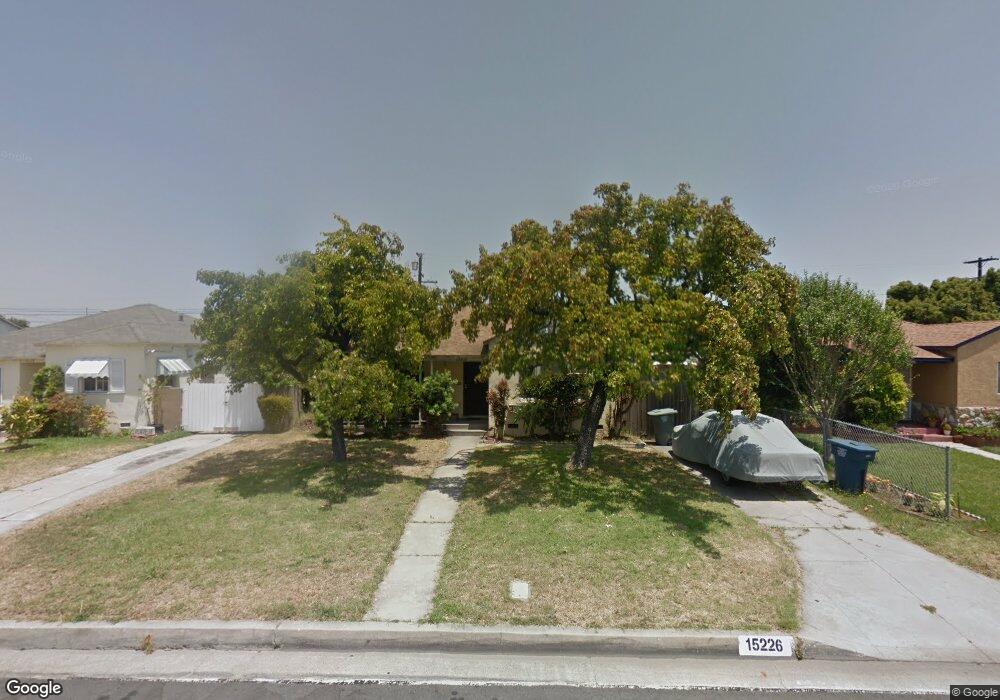
15226 Atkinson Ave Gardena, CA 90249
Estimated Value: $730,000 - $809,401
3
Beds
2
Baths
1,060
Sq Ft
$716/Sq Ft
Est. Value
About This Home
This home is located at 15226 Atkinson Ave, Gardena, CA 90249 and is currently estimated at $758,600, approximately $715 per square foot. 15226 Atkinson Ave is a home located in Los Angeles County with nearby schools including One Hundred Fifty-Sixth Street Elementary School, Robert E. Peary Middle School, and Gardena Senior High School.
Ownership History
Date
Name
Owned For
Owner Type
Purchase Details
Closed on
Aug 13, 2019
Sold by
Vanishing Point Properties Inc
Bought by
Khoe Wie Thong and Liu Elsy
Current Estimated Value
Home Financials for this Owner
Home Financials are based on the most recent Mortgage that was taken out on this home.
Original Mortgage
$375,000
Outstanding Balance
$328,431
Interest Rate
3.7%
Mortgage Type
Commercial
Estimated Equity
$430,169
Purchase Details
Closed on
Jul 12, 2019
Sold by
Roberts Mary Lue and The Olivia Schaeffer Trust
Bought by
Vanishing Point Properties Inc
Home Financials for this Owner
Home Financials are based on the most recent Mortgage that was taken out on this home.
Original Mortgage
$375,000
Outstanding Balance
$328,431
Interest Rate
3.7%
Mortgage Type
Commercial
Estimated Equity
$430,169
Purchase Details
Closed on
Feb 15, 2007
Sold by
Schaeffer Olivia
Bought by
Schaeffer Olivia and The Olivia Schaeffer Trust
Create a Home Valuation Report for This Property
The Home Valuation Report is an in-depth analysis detailing your home's value as well as a comparison with similar homes in the area
Home Values in the Area
Average Home Value in this Area
Purchase History
| Date | Buyer | Sale Price | Title Company |
|---|---|---|---|
| Khoe Wie Thong | $500,000 | Stewart Title Of Ca Inc | |
| Vanishing Point Properties Inc | $405,000 | Stewart Title | |
| Schaeffer Olivia | -- | None Available |
Source: Public Records
Mortgage History
| Date | Status | Borrower | Loan Amount |
|---|---|---|---|
| Open | Khoe Wie Thong | $375,000 | |
| Previous Owner | Vanishing Point Properties Inc | $430,000 |
Source: Public Records
Tax History
| Year | Tax Paid | Tax Assessment Tax Assessment Total Assessment is a certain percentage of the fair market value that is determined by local assessors to be the total taxable value of land and additions on the property. | Land | Improvement |
|---|---|---|---|---|
| 2025 | $6,896 | $562,894 | $437,456 | $125,438 |
| 2024 | $6,896 | $551,858 | $428,879 | $122,979 |
| 2023 | $6,772 | $541,038 | $420,470 | $120,568 |
| 2022 | $6,259 | $515,282 | $412,226 | $103,056 |
| 2021 | $6,195 | $505,180 | $404,144 | $101,036 |
| 2019 | $956 | $61,483 | $42,609 | $18,874 |
| 2018 | $911 | $60,278 | $41,774 | $18,504 |
| 2016 | $855 | $57,939 | $40,152 | $17,787 |
| 2015 | $839 | $57,069 | $39,549 | $17,520 |
| 2014 | $842 | $55,952 | $38,775 | $17,177 |
Source: Public Records
Map
Nearby Homes
- 3129 Marine Ave Unit 7
- 15213 Arcturus Ave
- 2824 W 156th St Unit 2
- 2824 W 156th St
- 3245 Marine Ave
- 14751 Wadkins Ave
- 14623 Roxton Ave
- 2612 Manhattan Beach Blvd
- 15423 Van Ness Ave
- 2116 Marine Ave
- 15830 Jupiter Place
- 3611 W 153rd St
- 2501 W Redondo Beach Blvd Unit 306
- 16028 Arcturus Ave
- 2027 W 152nd St
- 2112 W 157th St
- 15325 Gramercy Place
- 3225 W Rosecrans Ave
- 14405 Cerise Ave Unit 13
- 13957 Lemoli Ave
- 15232 Atkinson Ave
- 15222 Atkinson Ave
- 15236 Atkinson Ave
- 15218 Atkinson Ave
- 15227 Chanera Ave
- 15221 Atkinson Ave
- 15233 Chanera Ave
- 15223 Chanera Ave
- 15237 Chanera Ave
- 15219 Chanera Ave
- 15242 Atkinson Ave
- 15212 Atkinson Ave
- 15243 Chanera Ave
- 15213 Chanera Ave
- 15223 Atkinson Ave
- 15220 Crenshaw Blvd
- 15246 Atkinson Ave
- 15206 Atkinson Ave
- 15237 Atkinson Ave
- 15247 Chanera Ave
Your Personal Tour Guide
Ask me questions while you tour the home.