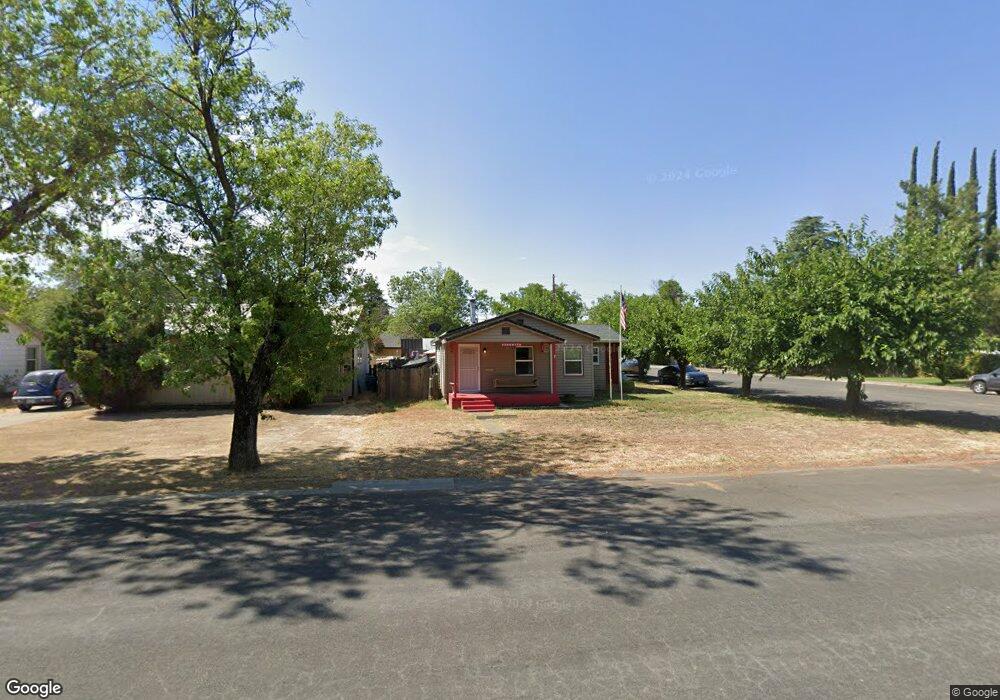
1523 Colusa St Corning, CA 96021
Estimated Value: $223,000 - $284,000
2
Beds
1
Bath
952
Sq Ft
$261/Sq Ft
Est. Value
About This Home
This home is located at 1523 Colusa St, Corning, CA 96021 and is currently estimated at $248,034, approximately $260 per square foot. 1523 Colusa St is a home located in Tehama County with nearby schools including Woodson Elementary School, Maywood Middle School, and Corning High School.
Ownership History
Date
Name
Owned For
Owner Type
Purchase Details
Closed on
Jul 2, 2025
Sold by
Beckwith James A
Bought by
James Alvin Beckwith Jr Trust and Beckwith
Current Estimated Value
Purchase Details
Closed on
Sep 23, 2003
Sold by
Chambers Thomas R and Chambers Betty A
Bought by
Beckwith James A and Beckwith Doris
Home Financials for this Owner
Home Financials are based on the most recent Mortgage that was taken out on this home.
Original Mortgage
$90,000
Interest Rate
5.98%
Mortgage Type
Unknown
Purchase Details
Closed on
Jul 27, 2001
Sold by
Beckwith Doris and Johnson Doris
Bought by
Beckwith James A and Beckwith Doris
Create a Home Valuation Report for This Property
The Home Valuation Report is an in-depth analysis detailing your home's value as well as a comparison with similar homes in the area
Home Values in the Area
Average Home Value in this Area
Purchase History
| Date | Buyer | Sale Price | Title Company |
|---|---|---|---|
| James Alvin Beckwith Jr Trust | -- | None Listed On Document | |
| Beckwith James A | -- | Northern California Title Co | |
| Beckwith James A | -- | Northern California Title Co |
Source: Public Records
Mortgage History
| Date | Status | Borrower | Loan Amount |
|---|---|---|---|
| Previous Owner | Beckwith Doris | $117,310 | |
| Previous Owner | Beckwith James A | $121,578 | |
| Previous Owner | Beckwith James A | $108,293 | |
| Previous Owner | Beckwith James A | $90,000 | |
| Previous Owner | Chambers Thomas R | $18,000 | |
| Previous Owner | Beckwith James A | $62,270 | |
| Previous Owner | Beckwith James A | $14,371 | |
| Closed | Beckwith James A | $12,000 |
Source: Public Records
Tax History Compared to Growth
Tax History
| Year | Tax Paid | Tax Assessment Tax Assessment Total Assessment is a certain percentage of the fair market value that is determined by local assessors to be the total taxable value of land and additions on the property. | Land | Improvement |
|---|---|---|---|---|
| 2025 | $1,042 | $107,750 | $27,926 | $79,824 |
| 2023 | $1,021 | $103,568 | $26,843 | $76,725 |
| 2022 | $1,005 | $101,538 | $26,317 | $75,221 |
| 2021 | $966 | $99,548 | $25,801 | $73,747 |
| 2020 | $975 | $98,528 | $25,537 | $72,991 |
| 2019 | $934 | $96,597 | $25,037 | $71,560 |
| 2018 | $934 | $94,704 | $24,547 | $70,157 |
| 2017 | $927 | $92,848 | $24,066 | $68,782 |
| 2016 | $863 | $91,029 | $23,595 | $67,434 |
| 2015 | $857 | $89,663 | $23,241 | $66,422 |
| 2014 | $840 | $87,907 | $22,786 | $65,121 |
Source: Public Records
Map
Nearby Homes
- 330 Houghton Ave
- 1419 Yolo St
- 311 6th St
- 1938 Colusa St
- 1414 Marin St
- 818 6th St
- 305 5th St
- 1547 Blackburn Ave
- 1980 Colusa St
- 1495 South St
- 1195 West St
- 1013 Toomes Ave
- 342 Rio Vista Ct
- 1162 5th Ave
- 2098 North St
- 272 Rio Bravo Ct
- 2018 Donnovan Ave
- 0 Toomes Ave Unit SN24222817
- 707 Marin St
- 705 Marin St