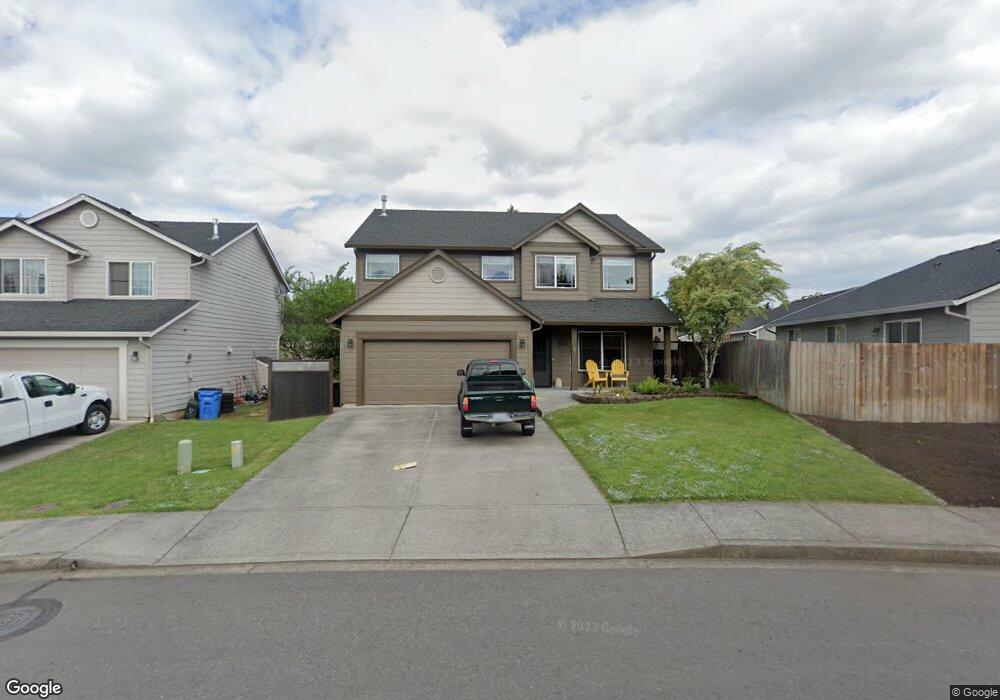
1523 E Caples Ct La Center, WA 98629
Estimated Value: $546,156 - $670,000
4
Beds
3
Baths
2,026
Sq Ft
$294/Sq Ft
Est. Value
About This Home
This home is located at 1523 E Caples Ct, La Center, WA 98629 and is currently estimated at $596,039, approximately $294 per square foot. 1523 E Caples Ct is a home located in Clark County with nearby schools including La Center Elementary School, La Center Middle School, and La Center High School.
Ownership History
Date
Name
Owned For
Owner Type
Purchase Details
Closed on
Jan 30, 2024
Sold by
Gillotte John
Bought by
Gillotte John Matthew and Gillotte Jana Dileen
Current Estimated Value
Purchase Details
Closed on
May 8, 2013
Sold by
Bosch Sherry D and Bosch William F
Bought by
Gillotte John
Home Financials for this Owner
Home Financials are based on the most recent Mortgage that was taken out on this home.
Original Mortgage
$225,200
Interest Rate
3.54%
Mortgage Type
VA
Purchase Details
Closed on
Sep 23, 2004
Sold by
Hanson Scott S and Hanson Tracy E
Bought by
Bosch William F and Bosch Sherry D
Purchase Details
Closed on
Sep 11, 2001
Sold by
Lemco Homes Inc
Bought by
Hanson Scott S and Hanson Tracy E
Home Financials for this Owner
Home Financials are based on the most recent Mortgage that was taken out on this home.
Original Mortgage
$144,000
Interest Rate
8.25%
Create a Home Valuation Report for This Property
The Home Valuation Report is an in-depth analysis detailing your home's value as well as a comparison with similar homes in the area
Home Values in the Area
Average Home Value in this Area
Purchase History
| Date | Buyer | Sale Price | Title Company |
|---|---|---|---|
| Gillotte John Matthew | $313 | None Listed On Document | |
| Gillotte John | $220,500 | Stewart Title | |
| Bosch William F | $150,421 | Fidelity National Title | |
| Hanson Scott S | $180,000 | First American Title Ins Co |
Source: Public Records
Mortgage History
| Date | Status | Borrower | Loan Amount |
|---|---|---|---|
| Previous Owner | Gillotte John | $225,200 | |
| Previous Owner | Hanson Scott S | $144,000 | |
| Closed | Hanson Scott S | $36,000 |
Source: Public Records
Tax History
| Year | Tax Paid | Tax Assessment Tax Assessment Total Assessment is a certain percentage of the fair market value that is determined by local assessors to be the total taxable value of land and additions on the property. | Land | Improvement |
|---|---|---|---|---|
| 2025 | $4,405 | $486,482 | $154,500 | $331,982 |
| 2024 | $4,107 | $475,922 | $154,500 | $321,422 |
| 2023 | $4,218 | $462,228 | $150,000 | $312,228 |
| 2022 | $4,051 | $458,584 | $141,500 | $317,084 |
| 2021 | $4,026 | $390,830 | $114,200 | $276,630 |
| 2020 | $3,814 | $365,818 | $106,400 | $259,418 |
| 2019 | $3,656 | $338,764 | $96,260 | $242,504 |
| 2018 | $3,354 | $330,577 | $0 | $0 |
| 2017 | $2,938 | $299,258 | $0 | $0 |
| 2016 | $2,910 | $278,048 | $0 | $0 |
Source: Public Records
Map
Nearby Homes
- 1189 E Ennis Ct
- 108 W 16th St
- 1241 E Southview Heights Dr
- 734 E 15th Cir
- 1319 Aspen Ave
- 1214 W Avocet Place
- 525 E 17th Cir
- 1202 W Avocet Place
- 725 Aspen Ave
- 703 E Stonecreek Dr
- 142 W 20th Way
- 403 W 19th St
- 594 E 5th St
- 404 W 20th Way
- 135 E Airedale Ave
- 410 W 20th Way
- 1296 E Lucas St
- 516 W 20th Way
- 521 W 20th Way
- 1127 W 15th St
- 1559 E Caples Ct
- 451 E Heritage Loop
- 473 E Heritage Loop
- 1585 E Caples Ct
- 391 E Heritage Loop
- 1609 E Caples Ct
- 572 E 15th Cir
- 1534 E Caples Ct
- 353 E Heritage Loop
- 1633 E Caples Ct
- 586 E 15th Cir
- 460 E Heritage Loop
- 438 E Heritage Loop
- 1570 E Caples Ct
- 482 E Heritage Loop
- 311 E Heritage Loop
- 1582 E Caples Ct
- 552 E 15th Cir
- 1657 E Caples Ct
- 540 E Heritage Loop
Your Personal Tour Guide
Ask me questions while you tour the home.