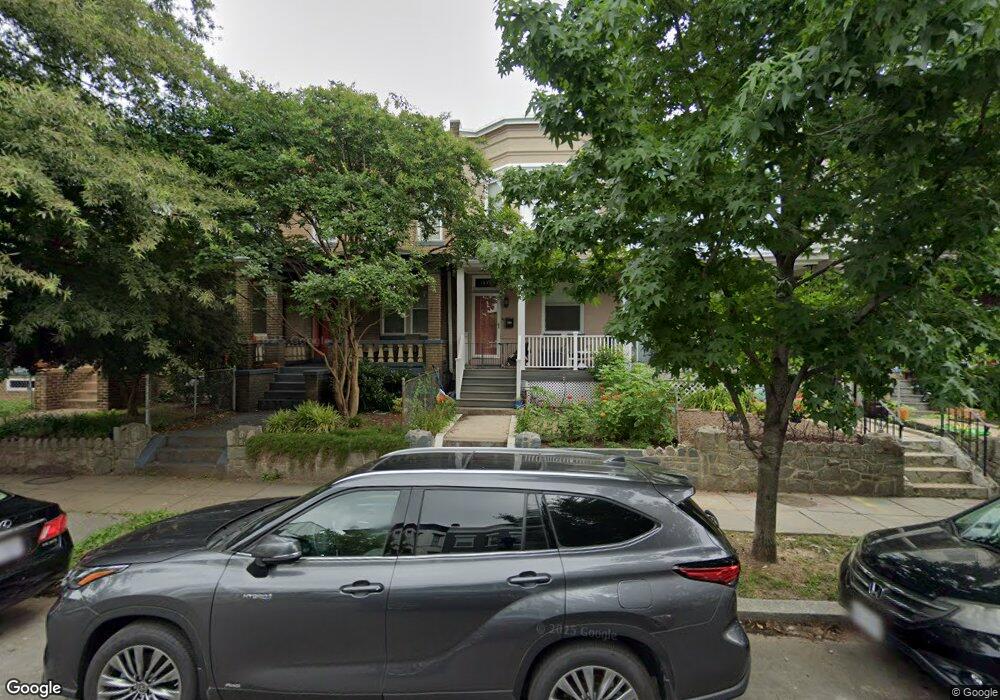
1524 A St NE Washington, DC 20002
Kingman Park NeighborhoodEstimated Value: $618,000 - $885,000
3
Beds
2
Baths
1,512
Sq Ft
$519/Sq Ft
Est. Value
About This Home
This home is located at 1524 A St NE, Washington, DC 20002 and is currently estimated at $784,348, approximately $518 per square foot. 1524 A St NE is a home located in District of Columbia with nearby schools including Maury Elementary School, Eliot-Hine Middle School, and Eastern High School.
Ownership History
Date
Name
Owned For
Owner Type
Purchase Details
Closed on
Feb 11, 2019
Sold by
Ackley Emily L
Bought by
Ackley James A and Ackley Emily L
Current Estimated Value
Home Financials for this Owner
Home Financials are based on the most recent Mortgage that was taken out on this home.
Original Mortgage
$194,000
Outstanding Balance
$169,510
Interest Rate
4.3%
Mortgage Type
New Conventional
Estimated Equity
$614,838
Purchase Details
Closed on
May 29, 2009
Sold by
Aurora Loan Servies Llc
Bought by
Leeding Emily
Purchase Details
Closed on
Dec 23, 2008
Sold by
Nadel Scott
Bought by
Aurora Loan Services Llc
Purchase Details
Closed on
Oct 30, 1995
Sold by
Sec Of Hud
Bought by
Ware Dorothy S
Home Financials for this Owner
Home Financials are based on the most recent Mortgage that was taken out on this home.
Original Mortgage
$68,000
Interest Rate
7.6%
Purchase Details
Closed on
Oct 13, 1994
Sold by
Royall Willa E
Bought by
Sec Of Hud
Create a Home Valuation Report for This Property
The Home Valuation Report is an in-depth analysis detailing your home's value as well as a comparison with similar homes in the area
Home Values in the Area
Average Home Value in this Area
Purchase History
| Date | Buyer | Sale Price | Title Company |
|---|---|---|---|
| Ackley James A | -- | None Available | |
| Leeding Emily | $302,000 | -- | |
| Aurora Loan Services Llc | $530,742 | -- | |
| Ware Dorothy S | $85,020 | -- | |
| Sec Of Hud | $92,374 | -- |
Source: Public Records
Mortgage History
| Date | Status | Borrower | Loan Amount |
|---|---|---|---|
| Open | Ackley James A | $194,000 | |
| Previous Owner | Ware Dorothy S | $68,000 |
Source: Public Records
Tax History Compared to Growth
Tax History
| Year | Tax Paid | Tax Assessment Tax Assessment Total Assessment is a certain percentage of the fair market value that is determined by local assessors to be the total taxable value of land and additions on the property. | Land | Improvement |
|---|---|---|---|---|
| 2025 | $5,725 | $763,380 | $428,010 | $335,370 |
| 2024 | $5,724 | $760,470 | $425,880 | $334,590 |
| 2023 | $5,615 | $748,810 | $414,310 | $334,500 |
| 2022 | $5,149 | $684,480 | $381,340 | $303,140 |
| 2021 | $4,875 | $649,830 | $369,460 | $280,370 |
| 2020 | $4,551 | $611,060 | $348,090 | $262,970 |
| 2019 | $4,347 | $586,310 | $331,290 | $255,020 |
| 2018 | $4,252 | $573,610 | $0 | $0 |
| 2017 | $4,657 | $547,930 | $0 | $0 |
| 2016 | $4,240 | $498,840 | $0 | $0 |
| 2015 | $3,849 | $452,870 | $0 | $0 |
| 2014 | $3,395 | $399,370 | $0 | $0 |
Source: Public Records
Map
Nearby Homes
- 1516 E Capitol St NE Unit J
- 1516 E Capitol St NE Unit F
- 1516 E Capitol St NE Unit 10
- 1516 E Capitol St NE Unit 2
- 1516 E Capitol St NE
- 1516 E Capitol St NE Unit 9
- 1516 E Capitol St NE Unit H
- 1449 A St NE Unit D
- 1441 A St NE Unit 1441
- 1414 N Carolina Ave NE
- 1443 E Capitol St SE Unit 1
- 16 17th St NE Unit 312
- 217 16th St NE Unit 1
- 251 14th Place NE
- 1355 Constitution Ave NE
- 208 17th Place NE
- 329 15th St NE
- 1374 C St NE
- 0 15th St SE Unit DCDC2196396
- 1702 A St SE