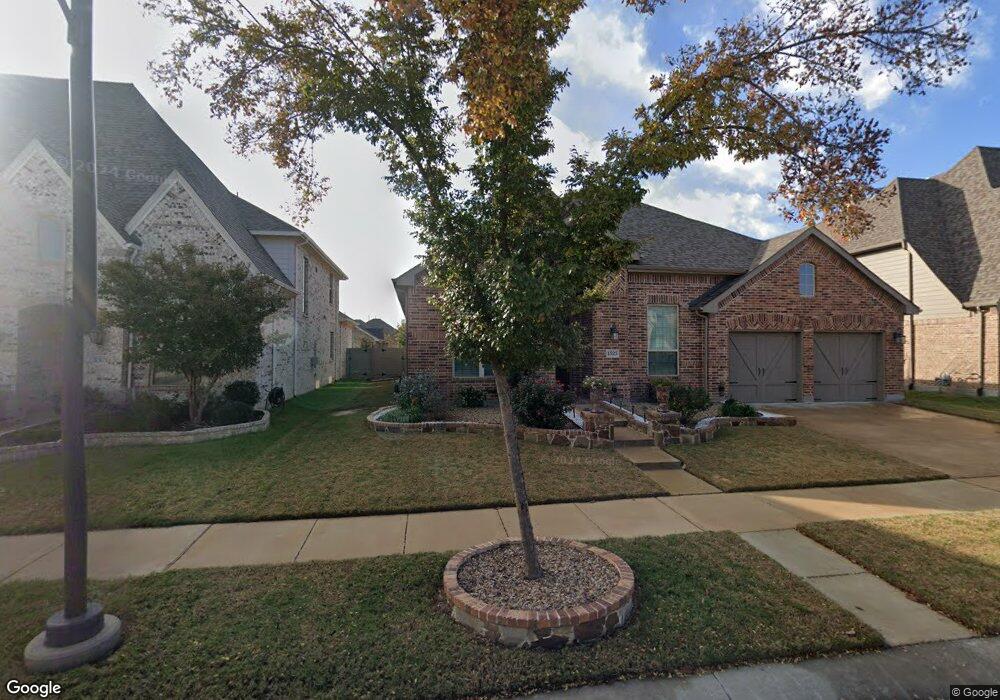
1525 10th St Argyle, TX 76226
Harvest NeighborhoodEstimated Value: $554,104 - $592,000
4
Beds
3
Baths
2,725
Sq Ft
$213/Sq Ft
Est. Value
About This Home
This home is located at 1525 10th St, Argyle, TX 76226 and is currently estimated at $580,026, approximately $212 per square foot. 1525 10th St is a home located in Denton County with nearby schools including Argyle West, Argyle Middle School, and Argyle High School.
Ownership History
Date
Name
Owned For
Owner Type
Purchase Details
Closed on
Jun 14, 2019
Sold by
Nash Karla Michelle
Bought by
Lozano Javier and Lozano Alba N
Current Estimated Value
Purchase Details
Closed on
Oct 31, 2017
Sold by
Highland Homes Dallas Llc
Bought by
Nash Karla Michelle
Home Financials for this Owner
Home Financials are based on the most recent Mortgage that was taken out on this home.
Original Mortgage
$382,495
Interest Rate
3.83%
Mortgage Type
New Conventional
Create a Home Valuation Report for This Property
The Home Valuation Report is an in-depth analysis detailing your home's value as well as a comparison with similar homes in the area
Home Values in the Area
Average Home Value in this Area
Purchase History
| Date | Buyer | Sale Price | Title Company |
|---|---|---|---|
| Lozano Javier | -- | Capital Title | |
| Nash Karla Michelle | -- | Old Republic National Title |
Source: Public Records
Mortgage History
| Date | Status | Borrower | Loan Amount |
|---|---|---|---|
| Previous Owner | Nash Karla Michelle | $382,495 |
Source: Public Records
Tax History
| Year | Tax Paid | Tax Assessment Tax Assessment Total Assessment is a certain percentage of the fair market value that is determined by local assessors to be the total taxable value of land and additions on the property. | Land | Improvement |
|---|---|---|---|---|
| 2025 | $7,589 | $578,096 | $167,786 | $420,853 |
| 2024 | $11,219 | $525,542 | $0 | $0 |
| 2023 | $7,463 | $477,765 | $108,413 | $524,325 |
| 2022 | $12,024 | $434,332 | $108,413 | $386,616 |
| 2021 | $11,347 | $394,847 | $92,925 | $301,922 |
| 2020 | $11,902 | $397,617 | $92,925 | $304,692 |
| 2019 | $11,813 | $381,000 | $92,925 | $288,075 |
| 2018 | $11,258 | $385,187 | $92,925 | $292,262 |
| 2017 | $1,070 | $55,755 | $55,755 | $0 |
| 2016 | $1,337 | $69,694 | $69,694 | $0 |
Source: Public Records
Map
Nearby Homes
Your Personal Tour Guide
Ask me questions while you tour the home.