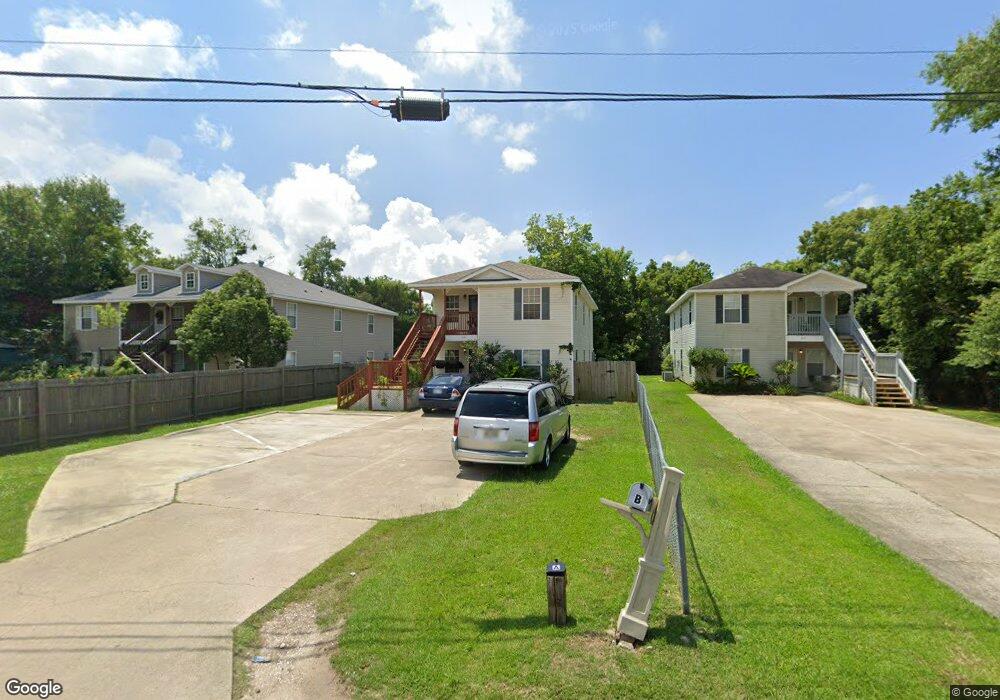
1525 3rd St Unit A Gulfport, MS 39501
East Beach NeighborhoodEstimated Value: $183,689 - $238,000
3
Beds
2
Baths
1,200
Sq Ft
$169/Sq Ft
Est. Value
About This Home
This home is located at 1525 3rd St Unit A, Gulfport, MS 39501 and is currently estimated at $202,922, approximately $169 per square foot. 1525 3rd St Unit A is a home located in Harrison County with nearby schools including Pass Road Elementary School, Gulfport Central Middle School, and Gulfport High School.
Ownership History
Date
Name
Owned For
Owner Type
Purchase Details
Closed on
Dec 18, 2015
Bought by
Coastal Investments Of Ms Llc
Current Estimated Value
Purchase Details
Closed on
Jul 29, 2013
Sold by
Not Provided
Bought by
Shilcox Logan K
Home Financials for this Owner
Home Financials are based on the most recent Mortgage that was taken out on this home.
Original Mortgage
$66,603
Interest Rate
4.43%
Mortgage Type
Purchase Money Mortgage
Create a Home Valuation Report for This Property
The Home Valuation Report is an in-depth analysis detailing your home's value as well as a comparison with similar homes in the area
Home Values in the Area
Average Home Value in this Area
Purchase History
| Date | Buyer | Sale Price | Title Company |
|---|---|---|---|
| Coastal Investments Of Ms Llc | -- | -- | |
| Shilcox Logan K | -- | -- |
Source: Public Records
Mortgage History
| Date | Status | Borrower | Loan Amount |
|---|---|---|---|
| Previous Owner | Shilcox Logan K | $66,603 |
Source: Public Records
Tax History Compared to Growth
Tax History
| Year | Tax Paid | Tax Assessment Tax Assessment Total Assessment is a certain percentage of the fair market value that is determined by local assessors to be the total taxable value of land and additions on the property. | Land | Improvement |
|---|---|---|---|---|
| 2024 | $2,563 | $19,425 | $0 | $0 |
| 2023 | $1,741 | $12,870 | $0 | $0 |
| 2022 | $1,741 | $12,870 | $0 | $0 |
| 2021 | $1,741 | $12,870 | $0 | $0 |
| 2020 | $1,687 | $12,471 | $0 | $0 |
| 2019 | $1,687 | $12,471 | $0 | $0 |
| 2018 | $1,687 | $12,471 | $0 | $0 |
| 2017 | $1,687 | $12,471 | $0 | $0 |
| 2015 | $2,510 | $18,555 | $0 | $0 |
| 2014 | -- | $20,385 | $0 | $0 |
| 2013 | -- | $18,555 | $2,745 | $15,810 |
Source: Public Records
Map
Nearby Homes