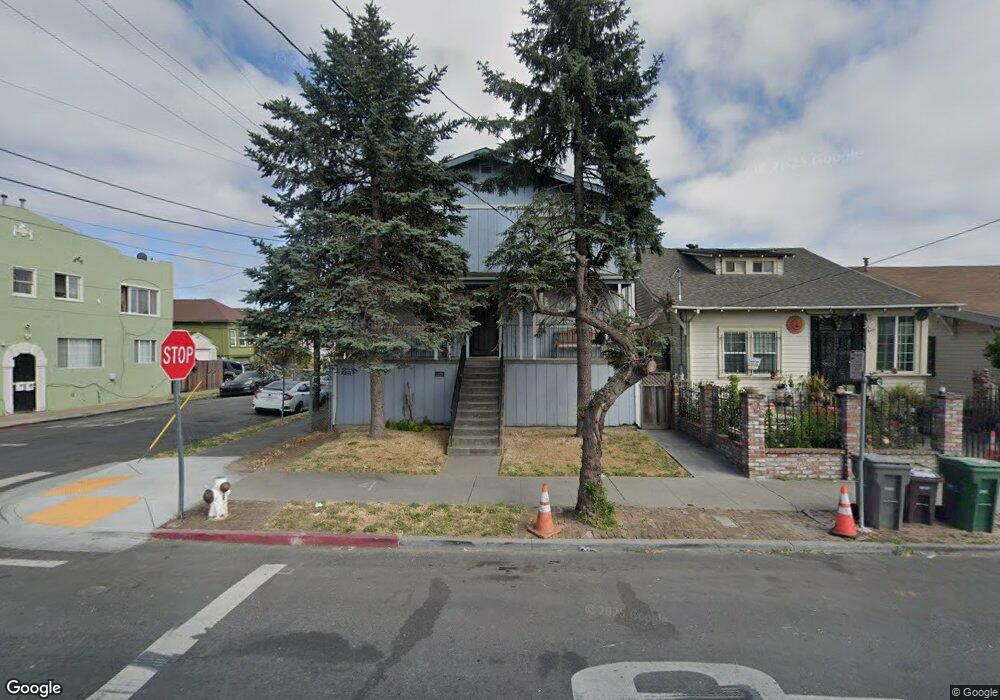
1526 55th Ave Oakland, CA 94621
Seminary NeighborhoodEstimated Value: $592,000 - $716,948
5
Beds
2
Baths
2,270
Sq Ft
$290/Sq Ft
Est. Value
About This Home
This home is located at 1526 55th Ave, Oakland, CA 94621 and is currently estimated at $657,237, approximately $289 per square foot. 1526 55th Ave is a home located in Alameda County with nearby schools including Greenleaf TK-8, Coliseum College Prep Academy, and Fremont High School.
Ownership History
Date
Name
Owned For
Owner Type
Purchase Details
Closed on
Dec 28, 2018
Sold by
Ibarra Domingo
Bought by
Flores Eliseo P and Gonzalez Mariaelena
Current Estimated Value
Home Financials for this Owner
Home Financials are based on the most recent Mortgage that was taken out on this home.
Original Mortgage
$434,250
Outstanding Balance
$385,716
Interest Rate
5.12%
Mortgage Type
FHA
Estimated Equity
$271,521
Purchase Details
Closed on
Aug 12, 2013
Sold by
Gonzalez Luis and Gonzalez Gema
Bought by
Ibarra Domingo
Home Financials for this Owner
Home Financials are based on the most recent Mortgage that was taken out on this home.
Original Mortgage
$200,000
Interest Rate
4.28%
Mortgage Type
New Conventional
Purchase Details
Closed on
Dec 18, 2003
Sold by
Borland Almar D and Borland Yuko
Bought by
Gonzalez Luis and Gonzalez Gema
Home Financials for this Owner
Home Financials are based on the most recent Mortgage that was taken out on this home.
Original Mortgage
$336,000
Interest Rate
6.03%
Mortgage Type
Stand Alone First
Create a Home Valuation Report for This Property
The Home Valuation Report is an in-depth analysis detailing your home's value as well as a comparison with similar homes in the area
Home Values in the Area
Average Home Value in this Area
Purchase History
| Date | Buyer | Sale Price | Title Company |
|---|---|---|---|
| Flores Eliseo P | $450,000 | Fidelity National Title Co | |
| Ibarra Domingo | $250,000 | Chicago Title Company | |
| Ibarra Domingo | -- | Chicago Title Company | |
| Gonzalez Luis | $420,000 | Chicago Title Co |
Source: Public Records
Mortgage History
| Date | Status | Borrower | Loan Amount |
|---|---|---|---|
| Open | Flores Eliseo P | $434,250 | |
| Previous Owner | Ibarra Domingo | $200,000 | |
| Previous Owner | Gonzalez Luis | $336,000 |
Source: Public Records
Tax History Compared to Growth
Tax History
| Year | Tax Paid | Tax Assessment Tax Assessment Total Assessment is a certain percentage of the fair market value that is determined by local assessors to be the total taxable value of land and additions on the property. | Land | Improvement |
|---|---|---|---|---|
| 2025 | $7,963 | $494,974 | $150,592 | $351,382 |
| 2024 | $7,963 | $485,133 | $147,640 | $344,493 |
| 2023 | $8,322 | $482,484 | $144,745 | $337,739 |
| 2022 | $8,085 | $466,025 | $141,907 | $331,118 |
| 2021 | $7,692 | $456,751 | $139,125 | $324,626 |
| 2020 | $7,607 | $459,000 | $137,700 | $321,300 |
| 2019 | $4,994 | $274,724 | $82,417 | $192,307 |
| 2018 | $4,893 | $269,340 | $80,802 | $188,538 |
| 2017 | $4,686 | $264,060 | $79,218 | $184,842 |
| 2016 | $4,477 | $258,881 | $77,664 | $181,217 |
| 2015 | $4,452 | $254,994 | $76,498 | $178,496 |
| 2014 | $4,440 | $250,000 | $75,000 | $175,000 |
Source: Public Records
Map
Nearby Homes
- 1605 57th Ave
- 5483 Wadean Place
- 5540 E 17th St
- 1604 57th Ave
- 5715 E 16th St
- 1424 57th Ave
- 5421 Wentworth Ave
- 5800 E 17th St
- 5910 International Blvd
- 1515 54th Ave
- 5914 International Blvd
- 2007 57th Ave
- 1321 60th Ave
- 1301 60th Ave
- 5444 Bancroft Ave
- 1244 58th Ave
- 1436 52nd Ave
- 5553 Harvey Ave
- 5217 Bancroft Ave
- 1830 Vicksburg Ave