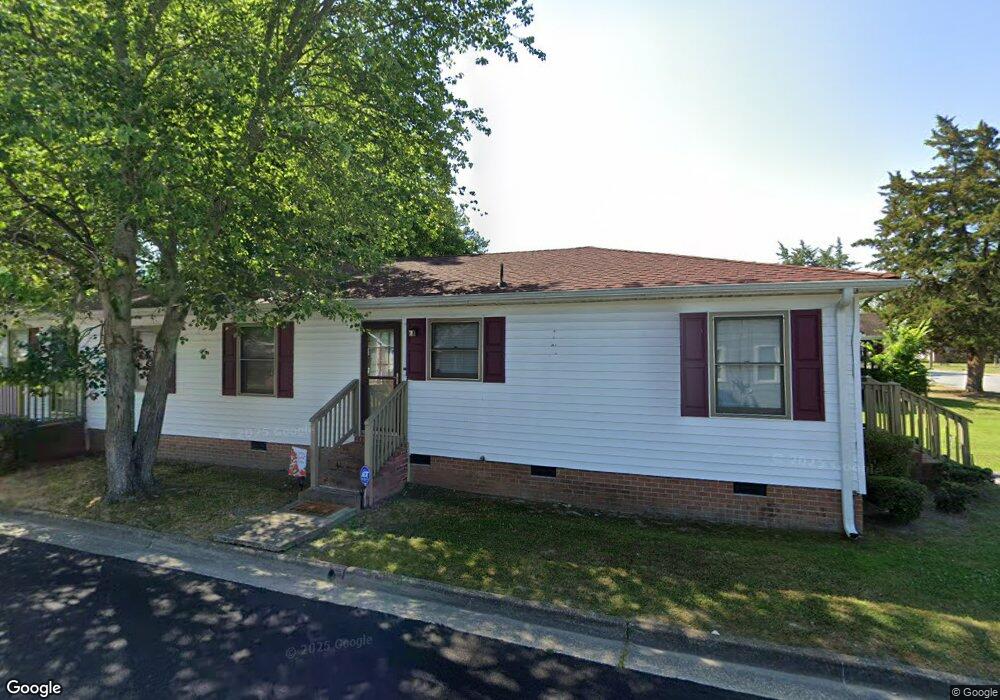
1526 Maplewood Ave Franklin, VA 23851
Estimated Value: $121,000 - $221,000
2
Beds
1
Bath
1,080
Sq Ft
$161/Sq Ft
Est. Value
About This Home
This home is located at 1526 Maplewood Ave, Franklin, VA 23851 and is currently estimated at $173,466, approximately $160 per square foot. 1526 Maplewood Ave is a home located in Franklin City with nearby schools including S.P. Morton Elementary School, Joseph P. King Jr. Middle School, and Franklin High School.
Ownership History
Date
Name
Owned For
Owner Type
Purchase Details
Closed on
May 6, 2020
Sold by
Scott William Anthony and Scott Audrey Murphy
Bought by
Scott William Anthony and Scott Audrey Murphy
Current Estimated Value
Purchase Details
Closed on
Mar 24, 2020
Sold by
Scott William Anthony and Scott Audrey Murphy
Bought by
Scott Garland M and The Whitney Brooke Scott Suppl
Purchase Details
Closed on
Jun 30, 2016
Sold by
Kello Robert F and Berardinis Constance Kello
Bought by
Applewhite Gregory A
Home Financials for this Owner
Home Financials are based on the most recent Mortgage that was taken out on this home.
Original Mortgage
$118,000
Outstanding Balance
$93,884
Interest Rate
3.56%
Mortgage Type
Farmers Home Administration
Estimated Equity
$79,582
Purchase Details
Closed on
Sep 11, 2015
Sold by
Kello Robert F and Berardinis Constance Kello
Bought by
Arrington Charles James
Create a Home Valuation Report for This Property
The Home Valuation Report is an in-depth analysis detailing your home's value as well as a comparison with similar homes in the area
Home Values in the Area
Average Home Value in this Area
Purchase History
| Date | Buyer | Sale Price | Title Company |
|---|---|---|---|
| Scott William Anthony | -- | None Available | |
| Scott Garland M | -- | None Available | |
| Scott William Anthony | -- | None Available | |
| Applewhite Gregory A | $175,000 | Attorney | |
| Arrington Charles James | $203,000 | None Available |
Source: Public Records
Mortgage History
| Date | Status | Borrower | Loan Amount |
|---|---|---|---|
| Open | Applewhite Gregory A | $118,000 |
Source: Public Records
Tax History Compared to Growth
Tax History
| Year | Tax Paid | Tax Assessment Tax Assessment Total Assessment is a certain percentage of the fair market value that is determined by local assessors to be the total taxable value of land and additions on the property. | Land | Improvement |
|---|---|---|---|---|
| 2025 | $830 | $80,600 | $10,500 | $70,100 |
| 2024 | $830 | $80,600 | $10,500 | $70,100 |
| 2023 | $567 | $55,000 | $7,700 | $47,300 |
| 2022 | $567 | $55,000 | $7,700 | $47,300 |
| 2021 | $529 | $51,400 | $7,000 | $44,400 |
| 2020 | $484 | $51,400 | $7,000 | $44,400 |
| 2019 | $484 | $48,900 | $7,000 | $41,900 |
| 2018 | $484 | $48,900 | $7,000 | $41,900 |
| 2017 | $549 | $55,500 | $14,200 | $41,300 |
| 2016 | $549 | $55,500 | $14,200 | $41,300 |
| 2015 | -- | $0 | $0 | $0 |
| 2014 | -- | $0 | $0 | $0 |
| 2013 | -- | $0 | $0 | $0 |
Source: Public Records
Map
Nearby Homes