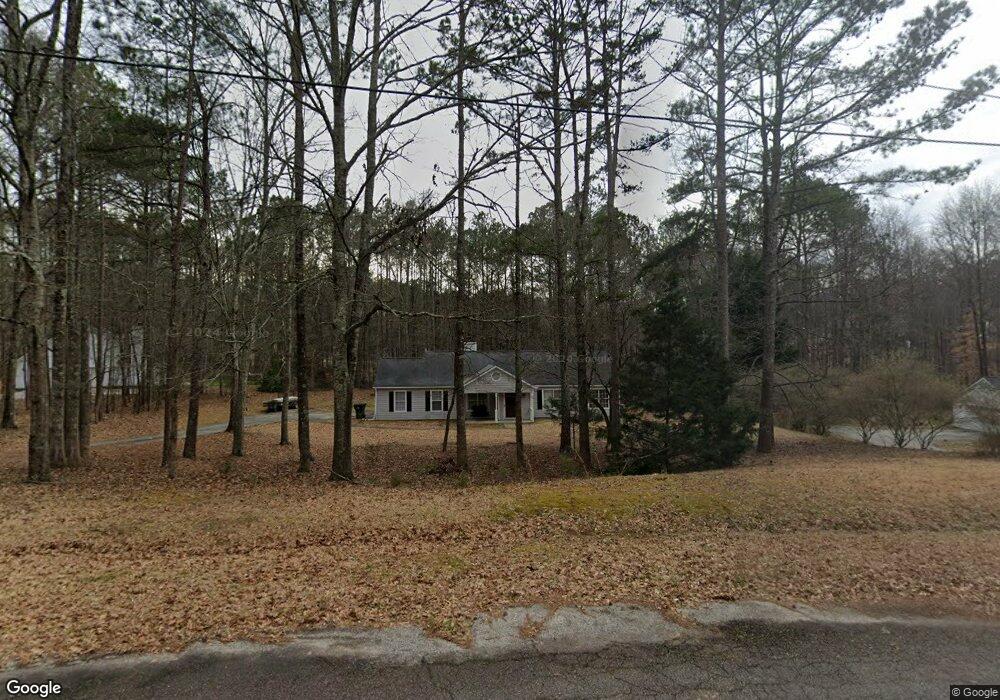
1526 Riverview Rd Unit 2 Monroe, GA 30655
Estimated Value: $274,689 - $303,000
Studio
--
Bath
1,255
Sq Ft
$229/Sq Ft
Est. Value
About This Home
This home is located at 1526 Riverview Rd Unit 2, Monroe, GA 30655 and is currently estimated at $287,672, approximately $229 per square foot. 1526 Riverview Rd Unit 2 is a home located in Walton County with nearby schools including Youth Elementary School, Youth Middle School, and Walnut Grove High School.
Ownership History
Date
Name
Owned For
Owner Type
Purchase Details
Closed on
Sep 13, 2000
Sold by
Clark Amy L
Bought by
Morrow Amy
Current Estimated Value
Home Financials for this Owner
Home Financials are based on the most recent Mortgage that was taken out on this home.
Original Mortgage
$108,950
Outstanding Balance
$37,697
Interest Rate
7.96%
Mortgage Type
FHA
Estimated Equity
$249,975
Purchase Details
Closed on
Mar 24, 1994
Sold by
Park Gregory A Mitzy K
Bought by
Clark Amy Lynn
Home Financials for this Owner
Home Financials are based on the most recent Mortgage that was taken out on this home.
Original Mortgage
$73,150
Interest Rate
7.47%
Mortgage Type
Purchase Money Mortgage
Purchase Details
Closed on
Jul 12, 1993
Sold by
Prime Homes Inc
Bought by
Park Gregory A and Park Mitzy Kelly
Home Financials for this Owner
Home Financials are based on the most recent Mortgage that was taken out on this home.
Original Mortgage
$74,750
Interest Rate
7.34%
Mortgage Type
FHA
Create a Home Valuation Report for This Property
The Home Valuation Report is an in-depth analysis detailing your home's value as well as a comparison with similar homes in the area
Home Values in the Area
Average Home Value in this Area
Purchase History
| Date | Buyer | Sale Price | Title Company |
|---|---|---|---|
| Morrow Amy | $109,900 | -- | |
| Clark Amy Lynn | $77,000 | -- | |
| Park Gregory A | $75,900 | -- |
Source: Public Records
Mortgage History
| Date | Status | Borrower | Loan Amount |
|---|---|---|---|
| Open | Morrow Amy | $108,950 | |
| Previous Owner | Clark Amy Lynn | $73,150 | |
| Previous Owner | Park Gregory A | $74,750 |
Source: Public Records
Tax History
| Year | Tax Paid | Tax Assessment Tax Assessment Total Assessment is a certain percentage of the fair market value that is determined by local assessors to be the total taxable value of land and additions on the property. | Land | Improvement |
|---|---|---|---|---|
| 2025 | $2,137 | $99,640 | $20,800 | $78,840 |
| 2024 | $2,137 | $85,920 | $20,800 | $65,120 |
| 2023 | $1,299 | $62,120 | $12,399 | $49,721 |
| 2022 | $1,870 | $62,120 | $12,399 | $49,721 |
| 2021 | $1,928 | $62,120 | $12,399 | $49,721 |
| 2020 | $1,884 | $57,800 | $12,000 | $45,800 |
| 2019 | $1,907 | $44,960 | $10,546 | $34,414 |
| 2018 | $1,553 | $44,960 | $10,546 | $34,414 |
| 2017 | $1,549 | $44,960 | $10,546 | $34,414 |
| 2016 | $1,577 | $44,960 | $12,000 | $32,960 |
| 2015 | $1,392 | $38,880 | $12,000 | $26,880 |
| 2014 | $1,341 | $36,480 | $0 | $0 |
Source: Public Records
Map
Nearby Homes
- 1446 River Falls View
- 1426 River Falls View
- 1769 Brandi Ln
- 1729 Brandi Ln
- 1510 Pecan Plantation Ct
- 744 Youth Jersey Rd
- 1240 Youth Jersey Rd
- 3545 Briscoe Dr
- 400 Jordan Ct
- 1746 Malachi Ct
- 2001 Raymonds Dr
- 3020 Meadow Trail
- 1425 Willowbend Place
- 1421 Willowbend Place
- 1416 Willowbend Place
- 1211 Highgrove Ct
- 1412 Willowbend Place
- 1409 Willowbend Place
- 1401 Willowbend Place
- 609 Whiporwill Cove
- 3177 River Forest Rd
- 3268 River Forest Rd
- 3248 River Forest Rd
- 3278 River Forest Rd
- 3258 River Forest Rd
- 3207 River Forest Rd Unit 3
- 3157 River Forest Rd
- 1546 Riverview Rd Unit 32
- 1546 Riverview Rd
- 3288 River Forest Rd Unit 3
- 3168 River Forest Rd
- 3227 River Forest Rd Unit 27
- 3227 River Forest Rd
- 3178 River Forest Rd
- 3237 River Forest Rd
- 3188 River Forest Rd
- 1535 Riverview Rd
- 3296 River Forest Rd Unit 3
- 3198 River Forest Rd Unit 2
- 3158 River Forest Rd Unit 3
Your Personal Tour Guide
Ask me questions while you tour the home.