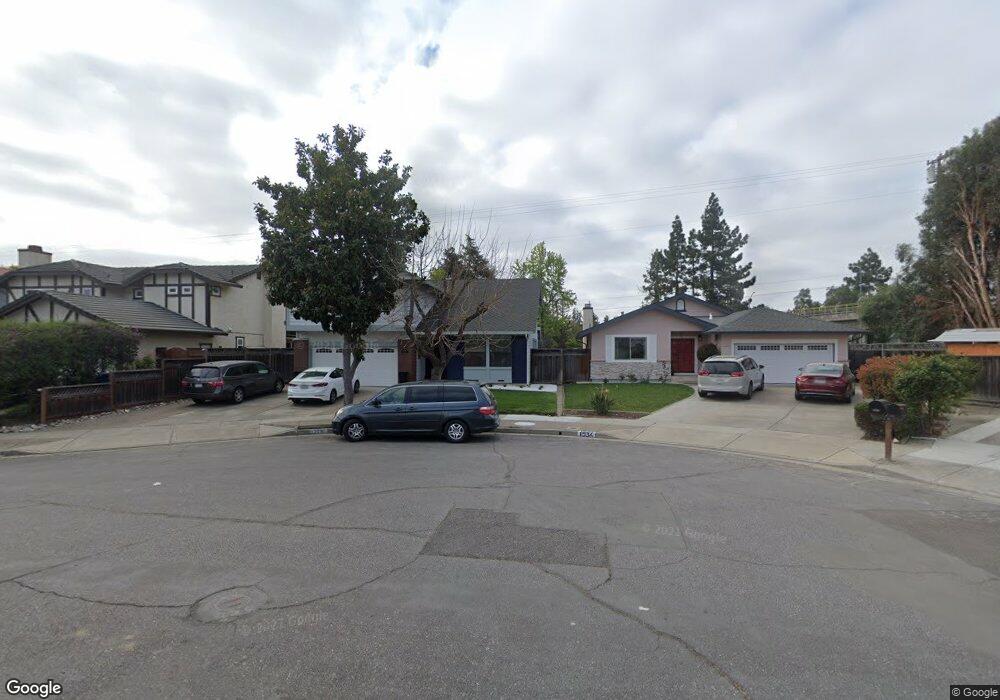
1526 Shinn Ct Fremont, CA 94536
Parkmont NeighborhoodEstimated Value: $1,690,000 - $2,160,000
5
Beds
3
Baths
2,369
Sq Ft
$820/Sq Ft
Est. Value
About This Home
This home is located at 1526 Shinn Ct, Fremont, CA 94536 and is currently estimated at $1,941,663, approximately $819 per square foot. 1526 Shinn Ct is a home located in Alameda County with nearby schools including Parkmont Elementary School, Centerville Junior High School, and Washington High School.
Ownership History
Date
Name
Owned For
Owner Type
Purchase Details
Closed on
Oct 30, 2018
Sold by
Bailey Kevin E and Bailey Marla A
Bought by
Dhillon Manpreet Singh and Bhatti Amrita
Current Estimated Value
Home Financials for this Owner
Home Financials are based on the most recent Mortgage that was taken out on this home.
Original Mortgage
$960,000
Outstanding Balance
$827,375
Interest Rate
3.87%
Mortgage Type
Adjustable Rate Mortgage/ARM
Estimated Equity
$1,114,288
Purchase Details
Closed on
Jan 27, 1998
Sold by
Yee Philip S and Yee Nancy M
Bought by
Bailey Kevin E and Bailey Marla A
Home Financials for this Owner
Home Financials are based on the most recent Mortgage that was taken out on this home.
Original Mortgage
$302,400
Interest Rate
7.12%
Purchase Details
Closed on
Jan 20, 1995
Sold by
Yee Philip Shiu Wai and Yee Nancy May
Bought by
Yee Philip Shiu Wai and Yee Nancy May
Create a Home Valuation Report for This Property
The Home Valuation Report is an in-depth analysis detailing your home's value as well as a comparison with similar homes in the area
Home Values in the Area
Average Home Value in this Area
Purchase History
| Date | Buyer | Sale Price | Title Company |
|---|---|---|---|
| Dhillon Manpreet Singh | $1,200,000 | Old Republic Title Company | |
| Bailey Kevin E | $378,000 | Chicago Title Co | |
| Yee Philip Shiu Wai | -- | -- | |
| Yee Philip Shiu Wai | -- | -- |
Source: Public Records
Mortgage History
| Date | Status | Borrower | Loan Amount |
|---|---|---|---|
| Open | Dhillon Manpreet Singh | $960,000 | |
| Previous Owner | Bailey Kevin E | $302,400 | |
| Closed | Bailey Kevin E | $37,800 |
Source: Public Records
Tax History Compared to Growth
Tax History
| Year | Tax Paid | Tax Assessment Tax Assessment Total Assessment is a certain percentage of the fair market value that is determined by local assessors to be the total taxable value of land and additions on the property. | Land | Improvement |
|---|---|---|---|---|
| 2025 | $15,687 | $1,338,600 | $446,200 | $892,400 |
| 2024 | $15,687 | $1,312,356 | $437,452 | $874,904 |
| 2023 | $15,281 | $1,286,628 | $428,876 | $857,752 |
| 2022 | $15,103 | $1,261,404 | $420,468 | $840,936 |
| 2021 | $14,729 | $1,236,672 | $412,224 | $824,448 |
| 2020 | $14,833 | $1,224,000 | $408,000 | $816,000 |
| 2019 | $14,662 | $1,200,000 | $400,000 | $800,000 |
| 2018 | $6,735 | $530,443 | $159,133 | $371,310 |
| 2017 | $6,566 | $520,044 | $156,013 | $364,031 |
| 2016 | $6,448 | $509,850 | $152,955 | $356,895 |
| 2015 | $6,358 | $502,191 | $150,657 | $351,534 |
| 2014 | $6,244 | $492,355 | $147,706 | $344,649 |
Source: Public Records
Map
Nearby Homes
- 1554 Gilbert Place
- 38131 Acacia St
- 38101 Cambridge Ct
- 37811 Fernwood Ct
- 38605 Vancouver Common
- 38455 Bronson St Unit 325
- 38043 Miller Place
- 2755 Country Dr Unit 311
- 38099 Miller Place
- 38500 Paseo Padre Pkwy Unit 306
- 38228 Paseo Padre Pkwy Unit 24
- 3006 Eggers Dr
- 38780 Tyson Ln Unit 205C
- 38780 Tyson Ln Unit 305C
- 37993 Ponderosa Terrace
- 2579 Bishop Ave
- 38623 Cherry Ln Unit 203
- 38623 Cherry Ln Unit 201
- 38623 Cherry Ln Unit 148
- 38623 Cherry Ln Unit 175