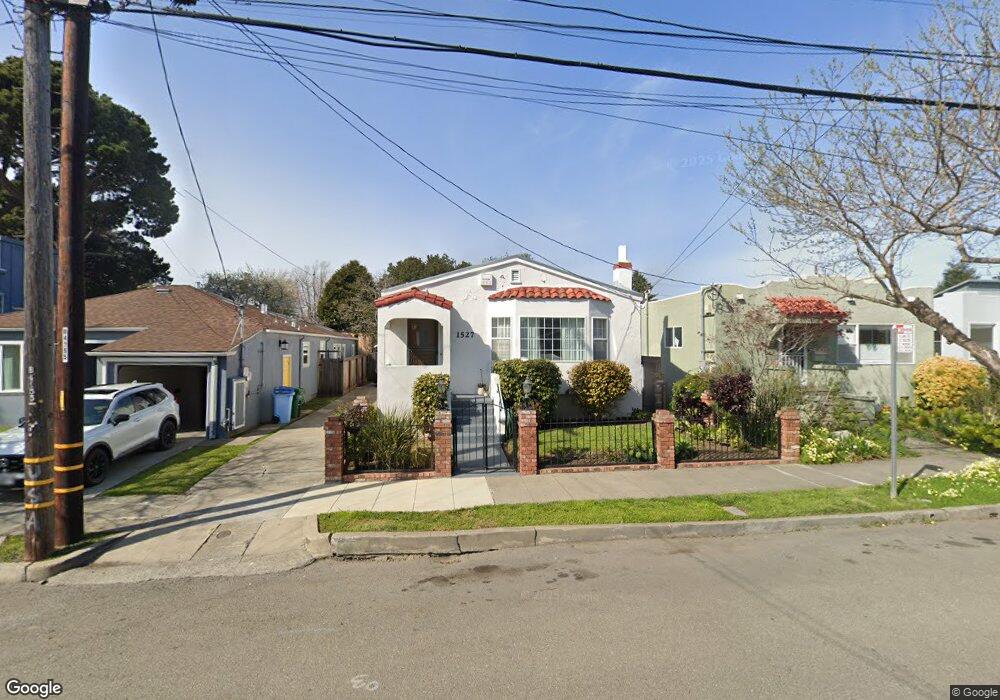
1527 Blake St Berkeley, CA 94703
South Berkeley NeighborhoodEstimated Value: $1,192,000 - $1,560,000
3
Beds
1
Bath
1,977
Sq Ft
$674/Sq Ft
Est. Value
About This Home
This home is located at 1527 Blake St, Berkeley, CA 94703 and is currently estimated at $1,331,706, approximately $673 per square foot. 1527 Blake St is a home located in Alameda County with nearby schools including Washington Elementary School, Malcolm X Elementary School, and Oxford Elementary School.
Ownership History
Date
Name
Owned For
Owner Type
Purchase Details
Closed on
Jul 1, 2019
Sold by
Covel Camille
Bought by
Covel Camille and The Camille Covel Living Trust
Current Estimated Value
Purchase Details
Closed on
Nov 9, 2017
Sold by
Davis Covel Camille and Davis George
Bought by
Covel Camille
Purchase Details
Closed on
Aug 9, 2004
Sold by
Davis George and Davis Fannie M
Bought by
Davis George and Davis Fannie Mae
Purchase Details
Closed on
Jun 9, 1994
Sold by
Davis George and Davis George
Bought by
Davis George and Davis Fannie M
Create a Home Valuation Report for This Property
The Home Valuation Report is an in-depth analysis detailing your home's value as well as a comparison with similar homes in the area
Home Values in the Area
Average Home Value in this Area
Purchase History
| Date | Buyer | Sale Price | Title Company |
|---|---|---|---|
| Covel Camille | -- | None Available | |
| Covel Camille | -- | None Available | |
| Davis George | -- | -- | |
| Davis George | -- | -- | |
| Davis George | -- | -- | |
| Davis George | -- | -- |
Source: Public Records
Tax History
| Year | Tax Paid | Tax Assessment Tax Assessment Total Assessment is a certain percentage of the fair market value that is determined by local assessors to be the total taxable value of land and additions on the property. | Land | Improvement |
|---|---|---|---|---|
| 2025 | $4,821 | $79,303 | $27,030 | $59,273 |
| 2024 | $4,821 | $77,612 | $26,501 | $58,111 |
| 2023 | $4,630 | $82,953 | $25,981 | $56,972 |
| 2022 | $4,415 | $74,327 | $25,472 | $55,855 |
| 2021 | $4,383 | $72,732 | $24,972 | $54,760 |
| 2020 | $3,999 | $78,914 | $24,716 | $54,198 |
| 2019 | $3,675 | $77,368 | $24,232 | $53,136 |
| 2018 | $3,559 | $75,851 | $23,757 | $52,094 |
| 2017 | $3,401 | $74,364 | $23,291 | $51,073 |
| 2016 | $3,162 | $72,905 | $22,834 | $50,071 |
| 2015 | $3,092 | $71,810 | $22,491 | $49,319 |
| 2014 | $3,012 | $70,403 | $22,050 | $48,353 |
Source: Public Records
Map
Nearby Homes
- 1612 Parker St
- 1515 Derby St
- 1612 Carleton St
- 1645 Dwight Way
- 2350 Sacramento St
- 2750 Sacramento St
- 1450 Ward St
- 2758 Sacramento St
- 2774 Sacramento St
- 2782 Sacramento St
- 2790 Sacramento St
- 2717 Mabel St
- 2701 Grant St
- 1144 Dwight Way
- 1142 Dwight Way
- 1901 Parker St Unit 3
- 2324 Browning St
- 1118 Dwight Way
- 2118 California St
- 1535 Julia St
Your Personal Tour Guide
Ask me questions while you tour the home.