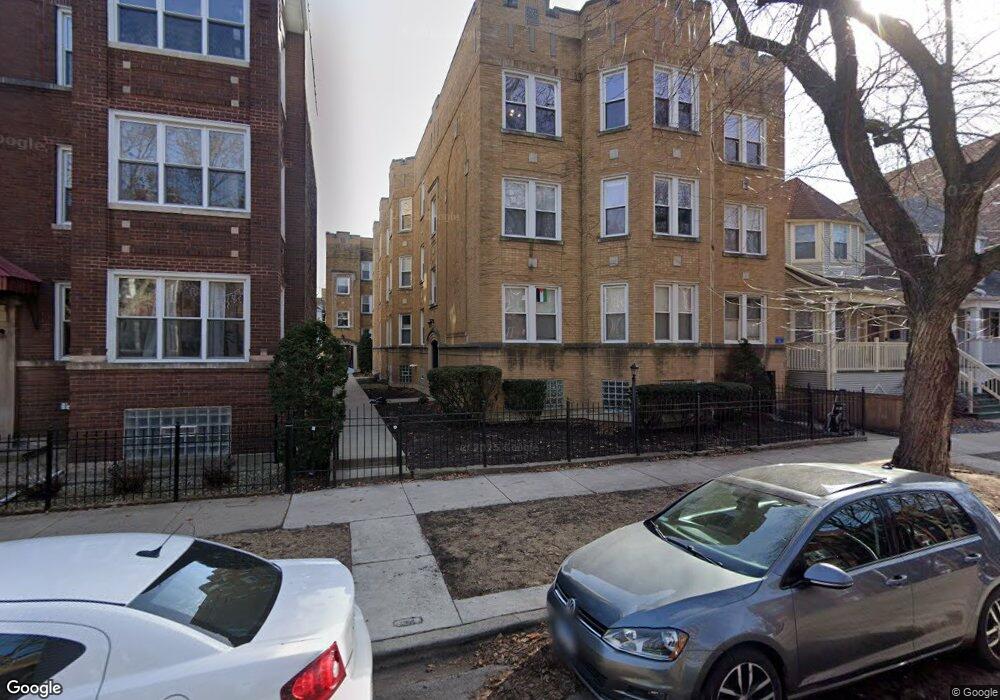
1529 W Rosemont Ave Unit 15293 Chicago, IL 60660
Edgewater NeighborhoodEstimated Value: $205,000 - $258,000
1
Bed
1
Bath
700
Sq Ft
$325/Sq Ft
Est. Value
About This Home
This home is located at 1529 W Rosemont Ave Unit 15293, Chicago, IL 60660 and is currently estimated at $227,404, approximately $324 per square foot. 1529 W Rosemont Ave Unit 15293 is a home located in Cook County with nearby schools including Hayt Elementary School, Senn High School, and Northside Catholic Academy.
Ownership History
Date
Name
Owned For
Owner Type
Purchase Details
Closed on
Aug 11, 2021
Sold by
Combest Christopher
Bought by
Allison Russell
Current Estimated Value
Purchase Details
Closed on
Jun 22, 2016
Sold by
Freeman James F and Scheller Lydia A
Bought by
Combest Christopher
Home Financials for this Owner
Home Financials are based on the most recent Mortgage that was taken out on this home.
Original Mortgage
$1,563,000
Interest Rate
3.37%
Mortgage Type
Adjustable Rate Mortgage/ARM
Purchase Details
Closed on
Jul 27, 2005
Sold by
Illinois Frontiera Properties Inc
Bought by
Scheller Lydia A and Freeman James F
Home Financials for this Owner
Home Financials are based on the most recent Mortgage that was taken out on this home.
Original Mortgage
$154,510
Interest Rate
5.12%
Mortgage Type
Adjustable Rate Mortgage/ARM
Create a Home Valuation Report for This Property
The Home Valuation Report is an in-depth analysis detailing your home's value as well as a comparison with similar homes in the area
Home Values in the Area
Average Home Value in this Area
Purchase History
| Date | Buyer | Sale Price | Title Company |
|---|---|---|---|
| Allison Russell | $165,000 | Chicago Title Insurance Co | |
| Combest Christopher | $170,000 | North American Title | |
| Scheller Lydia A | $194,000 | Ctic |
Source: Public Records
Mortgage History
| Date | Status | Borrower | Loan Amount |
|---|---|---|---|
| Previous Owner | Combest Christopher | $1,563,000 | |
| Previous Owner | Scheller Lydia A | $154,510 |
Source: Public Records
Tax History Compared to Growth
Tax History
| Year | Tax Paid | Tax Assessment Tax Assessment Total Assessment is a certain percentage of the fair market value that is determined by local assessors to be the total taxable value of land and additions on the property. | Land | Improvement |
|---|---|---|---|---|
| 2024 | $3,376 | $18,599 | $4,560 | $14,039 |
| 2023 | $3,291 | $16,001 | $3,667 | $12,334 |
| 2022 | $3,291 | $16,001 | $3,667 | $12,334 |
| 2021 | $2,548 | $15,999 | $3,666 | $12,333 |
| 2020 | $2,693 | $15,191 | $2,108 | $13,083 |
| 2019 | $2,688 | $16,808 | $2,108 | $14,700 |
| 2018 | $2,666 | $16,931 | $2,108 | $14,823 |
| 2017 | $1,833 | $11,892 | $1,833 | $10,059 |
| 2016 | $1,882 | $11,892 | $1,833 | $10,059 |
| 2015 | $1,698 | $11,892 | $1,833 | $10,059 |
| 2014 | $2,462 | $15,836 | $1,397 | $14,439 |
| 2013 | $2,402 | $15,836 | $1,397 | $14,439 |
Source: Public Records
Map
Nearby Homes
- 1542 W Highland Ave
- 1457 W Rosemont Ave Unit G
- 1626 W Highland Ave Unit 1W
- 6421 N Greenview Ave Unit 2W
- 1723 W Thome Ave
- 6321 N Hermitage Ave
- 6414 N Paulina St Unit G
- 1748 W Granville Ave Unit 2A
- 1435 W Arthur Ave Unit 1
- 1331 W Granville Ave
- 1762 W Highland Ave Unit 104
- 6447 N Glenwood Ave
- 6065 N Hermitage Ave
- 6532 N Ashland Ave
- 6220 N Ridge Ave Unit S307
- 6220 N Ridge Ave Unit S203
- 1243 W Rosemont Ave Unit 12433
- 6019 N Paulina St
- 1265 W Granville Ave Unit 3
- 6316 N Magnolia Ave
- 1531 W Rosemont Ave Unit 15312
- 1529 W Rosemont Ave Unit 15293
- 1529 W Rosemont Ave Unit 15292
- 1529 W Rosemont Ave Unit 15291
- 1529 W Rosemont Ave Unit 15292
- 1529 W Rosemont Ave Unit 15291
- 1527 W Rosemont Ave Unit 15273
- 1527 W Rosemont Ave Unit 15272
- 1527 W Rosemont Ave Unit 15271
- 1531 W Rosemont Ave Unit 15313
- 1531 W Rosemont Ave Unit 15311
- 1531 W Rosemont Ave Unit 15313
- 1531 W Rosemont Ave Unit 15312
- 1531 W Rosemont Ave Unit 15311
- 1531 W Rosemont Ave Unit 2S
- 1527 W Rosemont Ave Unit 1W
- 1531 W Rosemont Ave Unit 3N
- 1529 W Rosemont Ave Unit 3N
- 1529 W Rosemont Ave Unit 2S
- 1531 W Rosemont Ave Unit 2N