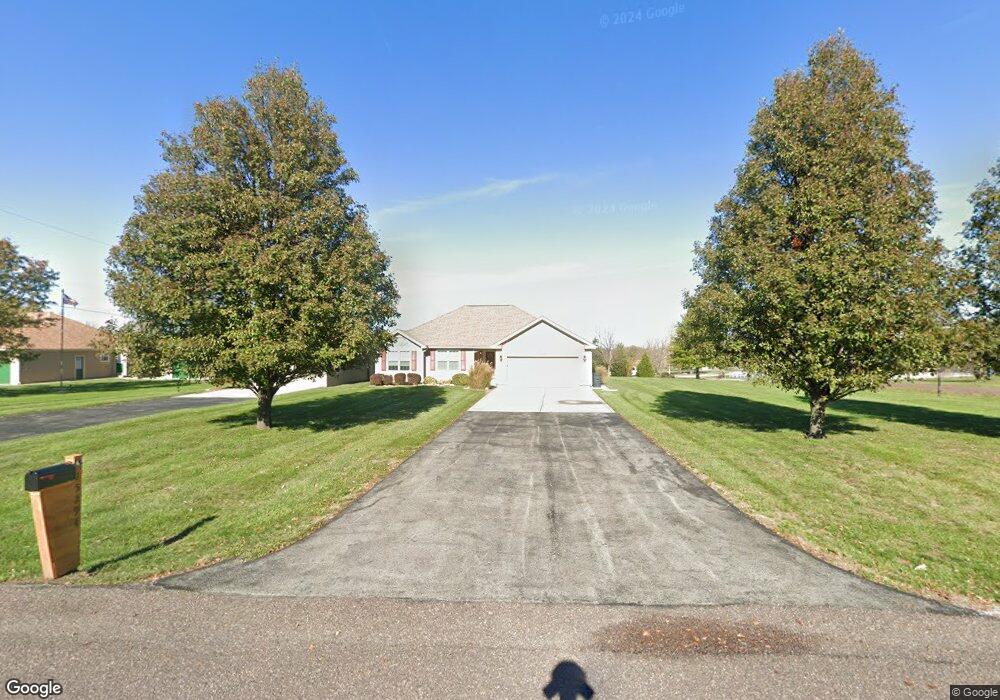
15294 Roger Rd Leavenworth, KS 66048
Estimated Value: $429,000 - $486,685
5
Beds
3
Baths
1,766
Sq Ft
$263/Sq Ft
Est. Value
About This Home
This home is located at 15294 Roger Rd, Leavenworth, KS 66048 and is currently estimated at $464,171, approximately $262 per square foot. 15294 Roger Rd is a home located in Leavenworth County with nearby schools including Lansing Elementary School, Lansing Middle 6-8, and Lansing High 9-12.
Ownership History
Date
Name
Owned For
Owner Type
Purchase Details
Closed on
May 15, 2009
Sold by
Michael Vanek and Michael Kimberly
Bought by
Freeman David D and Freeman Jane A
Current Estimated Value
Create a Home Valuation Report for This Property
The Home Valuation Report is an in-depth analysis detailing your home's value as well as a comparison with similar homes in the area
Home Values in the Area
Average Home Value in this Area
Purchase History
| Date | Buyer | Sale Price | Title Company |
|---|---|---|---|
| Freeman David D | $270,000 | -- |
Source: Public Records
Tax History Compared to Growth
Tax History
| Year | Tax Paid | Tax Assessment Tax Assessment Total Assessment is a certain percentage of the fair market value that is determined by local assessors to be the total taxable value of land and additions on the property. | Land | Improvement |
|---|---|---|---|---|
| 2025 | $5,409 | $50,569 | $6,284 | $44,285 |
| 2024 | $5,015 | $48,624 | $5,966 | $42,658 |
| 2023 | $5,015 | $47,207 | $5,966 | $41,241 |
| 2022 | $4,533 | $41,159 | $5,119 | $36,040 |
| 2021 | $4,455 | $40,113 | $4,221 | $35,892 |
| 2020 | $3,979 | $35,271 | $4,069 | $31,202 |
| 2019 | $3,709 | $33,120 | $3,724 | $29,396 |
| 2018 | $3,517 | $31,453 | $2,804 | $28,649 |
| 2017 | $3,338 | $29,785 | $2,592 | $27,193 |
| 2016 | $3,209 | $28,796 | $2,574 | $26,222 |
| 2015 | $3,101 | $27,876 | $2,574 | $25,302 |
| 2014 | $2,954 | $27,060 | $2,574 | $24,486 |
Source: Public Records
Map
Nearby Homes
- 15280 Roger Rd
- 15038 Fairmount Rd
- 14934 Fairmount Rd
- 22617 155th St
- 23802 140th St
- Lot 2 139th St
- 14165 Ashbury Ct
- 6508 141st St
- 833 Rock Creek Dr
- 13965 Mc Intyre Rd
- 5025 146th St
- 5023 146th St
- 5005 146th St
- 705 Rock Creek Dr
- 5020 146th St
- 5018 146th St
- 24431 139th St
- 1221 S Desoto Rd
- 5001 N 145th St
- 875 Clearview Dr
- 15324 Roger Rd
- 23501 153rd St
- 23502 153rd St
- 15301 Roger Rd
- 15350 Roger Rd
- 15325 Roger Rd
- 15230 Roger Rd
- 15351 Roger Rd
- 23526 153rd St
- 15301 Dempsey Rd
- 15231 Roger Rd
- 15380 Roger Rd
- 15309 Dempsey Rd
- 23525 153rd St
- 15200 Roger Rd
- 15294 Brandt Rd
- 15324 Brandt Rd
- 15291 Dempsey Rd
- 15280 Brandt Rd
- 15201 Roger Rd