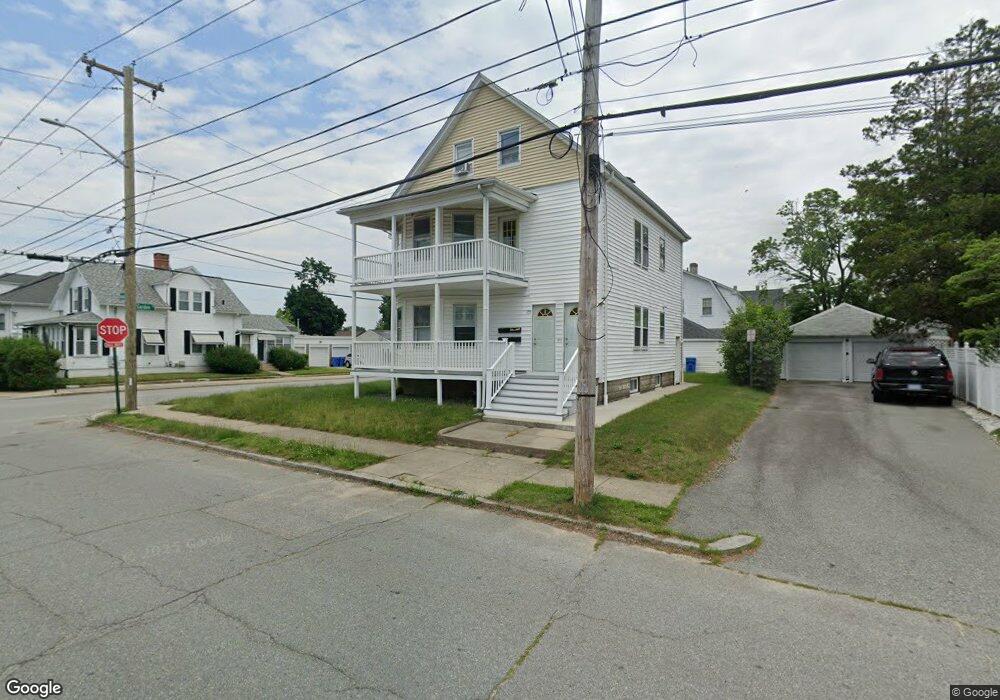
153 Auburn St Cranston, RI 02910
Auburn NeighborhoodEstimated Value: $407,481 - $609,000
3
Beds
3
Baths
2,202
Sq Ft
$231/Sq Ft
Est. Value
About This Home
This home is located at 153 Auburn St, Cranston, RI 02910 and is currently estimated at $507,870, approximately $230 per square foot. 153 Auburn St is a home located in Providence County with nearby schools including Eden Park Elementary School, Park View Middle School, and Cranston High School East.
Ownership History
Date
Name
Owned For
Owner Type
Purchase Details
Closed on
Jun 8, 2000
Sold by
Campbell Bruce C and Campbell Elaine
Bought by
Muserlian Richard A
Current Estimated Value
Home Financials for this Owner
Home Financials are based on the most recent Mortgage that was taken out on this home.
Original Mortgage
$100,300
Interest Rate
8.12%
Create a Home Valuation Report for This Property
The Home Valuation Report is an in-depth analysis detailing your home's value as well as a comparison with similar homes in the area
Home Values in the Area
Average Home Value in this Area
Purchase History
| Date | Buyer | Sale Price | Title Company |
|---|---|---|---|
| Muserlian Richard A | $111,500 | -- |
Source: Public Records
Mortgage History
| Date | Status | Borrower | Loan Amount |
|---|---|---|---|
| Closed | Muserlian Richard A | $100,000 | |
| Closed | Muserlian Richard A | $25,000 | |
| Closed | Muserlian Richard A | $103,000 | |
| Closed | Muserlian Richard A | $100,300 |
Source: Public Records
Tax History Compared to Growth
Tax History
| Year | Tax Paid | Tax Assessment Tax Assessment Total Assessment is a certain percentage of the fair market value that is determined by local assessors to be the total taxable value of land and additions on the property. | Land | Improvement |
|---|---|---|---|---|
| 2025 | $5,766 | $415,400 | $97,200 | $318,200 |
| 2024 | $5,654 | $415,400 | $97,200 | $318,200 |
| 2023 | $5,179 | $274,000 | $67,000 | $207,000 |
| 2022 | $5,072 | $274,000 | $67,000 | $207,000 |
| 2021 | $4,932 | $274,000 | $67,000 | $207,000 |
| 2020 | $4,868 | $234,400 | $63,700 | $170,700 |
| 2019 | $4,868 | $234,400 | $63,700 | $170,700 |
| 2018 | $4,756 | $234,400 | $63,700 | $170,700 |
| 2017 | $4,258 | $185,600 | $46,900 | $138,700 |
| 2016 | $4,167 | $185,600 | $46,900 | $138,700 |
| 2015 | $4,167 | $185,600 | $46,900 | $138,700 |
| 2014 | $3,449 | $151,000 | $46,900 | $104,100 |
Source: Public Records
Map
Nearby Homes
- 124 Clarence St
- 152 Woodbine St
- 1 Rolfe Square
- 483 Pontiac Ave
- 51 Norfolk St
- 36 Blackamore Ave
- 75 High School Ave
- 128 Elsie St
- 140 Eldridge St
- 115 Norfolk St
- 555 Park Ave
- 129 Wollaston St
- 1264 Elmwood Ave
- 18 Glenwood Ave
- 130 Wollaston St
- 545 Park Ave
- 105 Broadmoor Rd
- 140 Concord Ave
- 99 Dixon St
- 113 Alger Ave