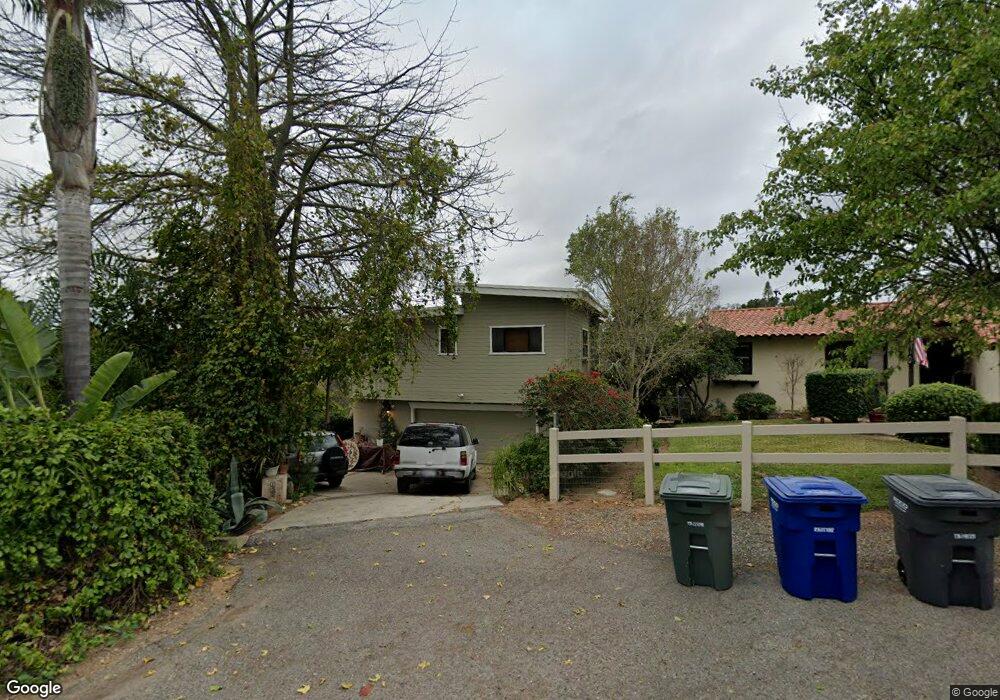
153 Bluff Point Rd Fallbrook, CA 92028
Estimated Value: $764,000 - $844,000
3
Beds
2
Baths
2,117
Sq Ft
$386/Sq Ft
Est. Value
About This Home
This home is located at 153 Bluff Point Rd, Fallbrook, CA 92028 and is currently estimated at $817,793, approximately $386 per square foot. 153 Bluff Point Rd is a home located in San Diego County with nearby schools including Fallbrook STEM Academy, James E. Potter Intermediate School, and Fallbrook High School.
Ownership History
Date
Name
Owned For
Owner Type
Purchase Details
Closed on
Jul 1, 2010
Sold by
Rappoport Susan A
Bought by
Rappoport Susan A
Current Estimated Value
Purchase Details
Closed on
Mar 31, 2010
Sold by
Newton Henry T and Elliot Deborah P
Bought by
Rappoport Susan A
Home Financials for this Owner
Home Financials are based on the most recent Mortgage that was taken out on this home.
Original Mortgage
$225,000
Outstanding Balance
$147,584
Interest Rate
5.01%
Mortgage Type
New Conventional
Estimated Equity
$670,209
Purchase Details
Closed on
Jan 2, 2008
Sold by
Newton Henry T
Bought by
Equity Holding Corp
Purchase Details
Closed on
Aug 1, 2007
Sold by
Newton Henry T
Bought by
Newton Henry T and Elliott Deborah P
Home Financials for this Owner
Home Financials are based on the most recent Mortgage that was taken out on this home.
Original Mortgage
$55,000
Interest Rate
6.62%
Mortgage Type
Credit Line Revolving
Purchase Details
Closed on
Apr 10, 2006
Sold by
Johnson Harold and Johnson Dianne Rohwer
Bought by
Newton Henry T
Purchase Details
Closed on
Apr 7, 2006
Sold by
Elliott Deborah P
Bought by
Newton Henry T
Purchase Details
Closed on
Oct 11, 2005
Sold by
Johnson Dianne and Johnson Rohwer D
Bought by
Rohwer D and D Rohwer 1998 Trust
Purchase Details
Closed on
Mar 2, 2004
Sold by
Rohwer John W
Bought by
Johnson Harold and Johnson Dianne
Home Financials for this Owner
Home Financials are based on the most recent Mortgage that was taken out on this home.
Original Mortgage
$280,000
Interest Rate
5.56%
Mortgage Type
Purchase Money Mortgage
Purchase Details
Closed on
Nov 14, 2002
Sold by
Rohwer John W
Bought by
Johnson Dianne
Purchase Details
Closed on
Aug 28, 1996
Sold by
Federal National Mortgage Association
Bought by
Rohwer Marjorie and Rohwer John
Home Financials for this Owner
Home Financials are based on the most recent Mortgage that was taken out on this home.
Original Mortgage
$145,500
Interest Rate
7.88%
Mortgage Type
Seller Take Back
Purchase Details
Closed on
May 20, 1996
Sold by
Hughes Valerie A and Strauch Raymond
Bought by
Federal National Mortgage Association
Purchase Details
Closed on
Jun 29, 1989
Purchase Details
Closed on
Sep 15, 1983
Create a Home Valuation Report for This Property
The Home Valuation Report is an in-depth analysis detailing your home's value as well as a comparison with similar homes in the area
Home Values in the Area
Average Home Value in this Area
Purchase History
| Date | Buyer | Sale Price | Title Company |
|---|---|---|---|
| Rappoport Susan A | -- | None Available | |
| Rappoport Susan A | $250,000 | Lawyers Title Company | |
| Newton Henry T | -- | Lawyers Title | |
| Equity Holding Corp | -- | None Available | |
| Newton Henry T | -- | First American Title | |
| Newton Henry T | -- | Ticor Title San Diego | |
| Newton Henry T | -- | Ticor Title San Diego | |
| Rohwer D | -- | -- | |
| Johnson Harold | $355,000 | New Century Title Company | |
| Rowher John W | -- | New Century Title Company | |
| Johnson Dianne | -- | New Century Title Company | |
| Johnson Dianne | -- | -- | |
| Rohwer Marjorie | $150,000 | First American Title Ins | |
| Federal National Mortgage Association | $170,088 | First American Title Ins Co | |
| -- | $160,000 | -- | |
| -- | $37,600 | -- |
Source: Public Records
Mortgage History
| Date | Status | Borrower | Loan Amount |
|---|---|---|---|
| Open | Rappoport Susan A | $225,000 | |
| Previous Owner | Newton Henry T | $55,000 | |
| Previous Owner | Newton Henry T | $440,000 | |
| Previous Owner | Johnson Harold | $280,000 | |
| Previous Owner | Rohwer Marjorie | $145,500 |
Source: Public Records
Tax History
| Year | Tax Paid | Tax Assessment Tax Assessment Total Assessment is a certain percentage of the fair market value that is determined by local assessors to be the total taxable value of land and additions on the property. | Land | Improvement |
|---|---|---|---|---|
| 2025 | $3,333 | $322,690 | $138,110 | $184,580 |
| 2024 | $3,333 | $316,363 | $135,402 | $180,961 |
| 2023 | $3,239 | $310,161 | $132,748 | $177,413 |
| 2022 | $3,239 | $304,081 | $130,146 | $173,935 |
| 2021 | $3,129 | $298,120 | $127,595 | $170,525 |
| 2020 | $3,152 | $295,064 | $126,287 | $168,777 |
| 2019 | $3,088 | $289,279 | $123,811 | $165,468 |
| 2018 | $3,040 | $283,608 | $121,384 | $162,224 |
| 2017 | $750 | $278,048 | $119,004 | $159,044 |
| 2016 | $2,903 | $272,597 | $116,671 | $155,926 |
| 2015 | $2,856 | $268,503 | $114,919 | $153,584 |
| 2014 | $2,801 | $263,244 | $112,668 | $150,576 |
Source: Public Records
Map
Nearby Homes
- 275 Royal Glen Dr
- 1006 N Orange Ave
- 842 Porter Way
- 408 N Pico Ave
- 510 Hilbert Dr
- 0 Via Vonnie Unit SW26054903
- 678 Robby Way
- 210 S Orange Ave
- 502 E Elder St
- 214 Summit Ave
- 1120 E Mission Rd Unit 33
- 1120 E Mission Rd Unit 39
- 1120 E Mission Rd Unit 44
- 1120 E Mission Rd Unit 22
- 1120 E Mission Rd Unit 102
- 1120 E Mission Rd Unit 20
- 1120 E Mission Rd Unit 79
- 1120 E Mission Rd Unit 57
- 1120 E Unit 39
- 741 Rossiter Ln
- 177 Bluff Point Rd
- 185 Bluff Point Rd
- 914 N Main Ave
- 910 N Main Ave
- 942 N Main Ave
- 908 N Main Ave
- 190 Bluff Point Rd
- 852 De Luz Rd
- 199 Bluff Point Rd
- 1026 N Main Ave
- 142 Bluebird Park Rd
- 914 De Luz Rd
- 136 Bluebird Park Rd
- 132 Bluebird Park Rd
- 172 Via Floresta
- 832 De Luz Rd
- 110 Bluebird Park Rd
- 1044 N Main Ave
- 180 Via Floresta
- 767 Ceramic Ln
Your Personal Tour Guide
Ask me questions while you tour the home.