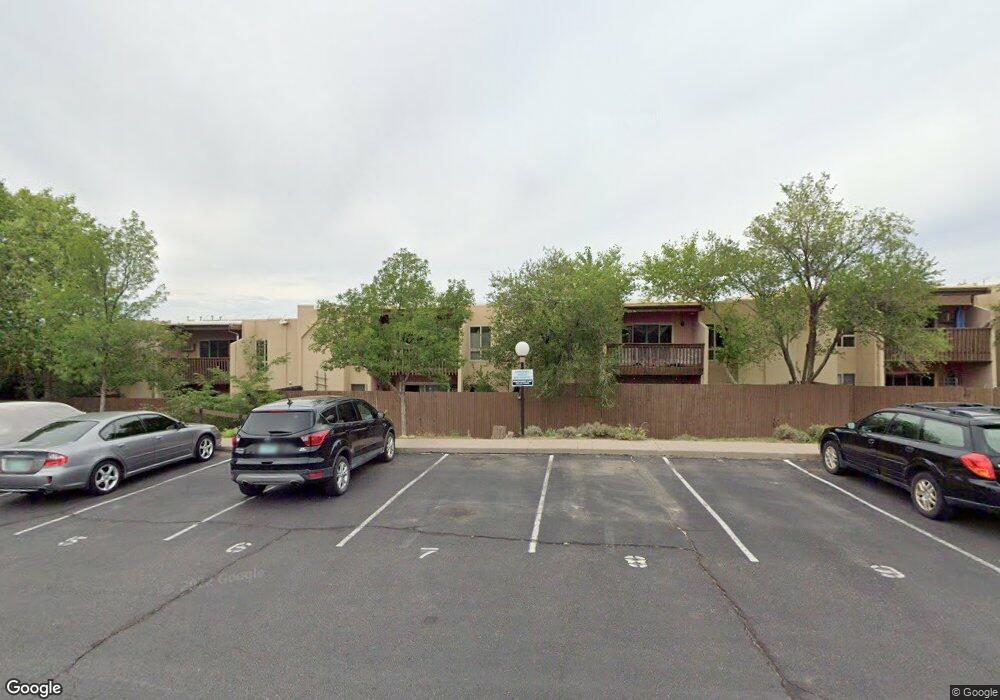
153 Calle Ojo Feliz Santa Fe, NM 87505
Arroyo Chamiso NeighborhoodEstimated Value: $259,000 - $300,000
2
Beds
2
Baths
891
Sq Ft
$307/Sq Ft
Est. Value
About This Home
This home is located at 153 Calle Ojo Feliz, Santa Fe, NM 87505 and is currently estimated at $273,846, approximately $307 per square foot. 153 Calle Ojo Feliz is a home located in Santa Fe County with nearby schools including E.J. Martinez Elementary School, Santa Fe High School, and Little Earth School.
Ownership History
Date
Name
Owned For
Owner Type
Purchase Details
Closed on
May 25, 2021
Sold by
Scally Marline Marquez and Scally Thomas
Bought by
Lac161g Llc
Current Estimated Value
Purchase Details
Closed on
Apr 18, 2013
Sold by
Federal Home Loan Mortgage Corporation
Bought by
Scally Marline Marquez and Scally Thomas
Home Financials for this Owner
Home Financials are based on the most recent Mortgage that was taken out on this home.
Original Mortgage
$34,900
Interest Rate
3.75%
Mortgage Type
Adjustable Rate Mortgage/ARM
Purchase Details
Closed on
Dec 28, 2011
Sold by
Romano Teri R
Bought by
Wells Fargo Bank Na
Purchase Details
Closed on
Sep 27, 2006
Sold by
Saltzman William and Saltzman Irene F
Bought by
Romano Teri R
Home Financials for this Owner
Home Financials are based on the most recent Mortgage that was taken out on this home.
Original Mortgage
$145,350
Interest Rate
6.51%
Mortgage Type
Purchase Money Mortgage
Create a Home Valuation Report for This Property
The Home Valuation Report is an in-depth analysis detailing your home's value as well as a comparison with similar homes in the area
Home Values in the Area
Average Home Value in this Area
Purchase History
| Date | Buyer | Sale Price | Title Company |
|---|---|---|---|
| Lac161g Llc | -- | None Available | |
| Scally Marline Marquez | -- | None Available | |
| Wells Fargo Bank Na | $115,000 | None Available | |
| Romano Teri R | -- | St&E |
Source: Public Records
Mortgage History
| Date | Status | Borrower | Loan Amount |
|---|---|---|---|
| Previous Owner | Scally Marline Marquez | $34,900 | |
| Previous Owner | Romano Teri R | $145,350 |
Source: Public Records
Tax History Compared to Growth
Tax History
| Year | Tax Paid | Tax Assessment Tax Assessment Total Assessment is a certain percentage of the fair market value that is determined by local assessors to be the total taxable value of land and additions on the property. | Land | Improvement |
|---|---|---|---|---|
| 2024 | $1,221 | $160,282 | -- | $160,282 |
| 2023 | $1,221 | $155,614 | $0 | $155,614 |
| 2022 | $1,194 | $151,082 | $0 | $151,082 |
| 2021 | $710 | $29,536 | $0 | $29,536 |
| 2020 | $689 | $28,676 | $0 | $28,676 |
| 2019 | $679 | $27,841 | $0 | $27,841 |
| 2018 | $664 | $27,030 | $0 | $27,030 |
| 2017 | $648 | $26,243 | $0 | $26,243 |
| 2016 | $611 | $25,479 | $0 | $25,479 |
| 2015 | $597 | $24,737 | $0 | $24,737 |
| 2014 | $561 | $23,993 | $0 | $23,993 |
Source: Public Records
Map
Nearby Homes
- 150 Calle Ojo Feliz
- 157 Calle Ojo Feliz Unit D
- 149 Calle Ojo Feliz Unit B
- 151 Calle Ojo Feliz Unit T
- 147 Calle Ojo Feliz Unit U
- 125 Chamiso Ln
- 2175 Old Arroyo Chamiso Unit 1,,2,3,4,5,6
- 2328 Calle Camarico
- 2306 Brother Luke Place
- 1566 Camino Amado
- 2305 Brother Abdon Way
- 2347 Botulph Rd
- 2210 Miguel Chavez Rd Unit 1616
- 2210 Miguel Chavez Rd Unit 812
- 2210 Miguel Chavez Rd Unit 723
- 2210 Miguel Chavez Rd Unit 1814
- 2210 Miguel Chavez Rd Unit 816
- 2210 Miguel Chavez Rd Unit 511
- 2210 Miguel Chavez Rd Unit 1816
- 2210 Miguel Chavez Rd Unit 1212
- 153 Calle Ojo Feliz
- 153 Calle Ojo Feliz
- 153 Calle Ojo Feliz
- 153 Calle Ojo Feliz
- 153 Calle Ojo Feliz
- 153 Calle Ojo Feliz
- 153 Calle Ojo Feliz
- 153 Calle Ojo Feliz
- 153 Calle Ojo Feliz
- 153 Calle Ojo Feliz
- 153 Calle Ojo Feliz
- 153 Calle Ojo Feliz
- 153 Calle Ojo Feliz
- 153 Calle Ojo Feliz
- 153 Calle Ojo Feliz
- 153 Calle Ojo Feliz
- 153 Calle Ojo Feliz Unit 280
- 153 Calle Ojo Feliz
- 153 Calle Ojo Feliz
- 153 Calle Ojo Feliz