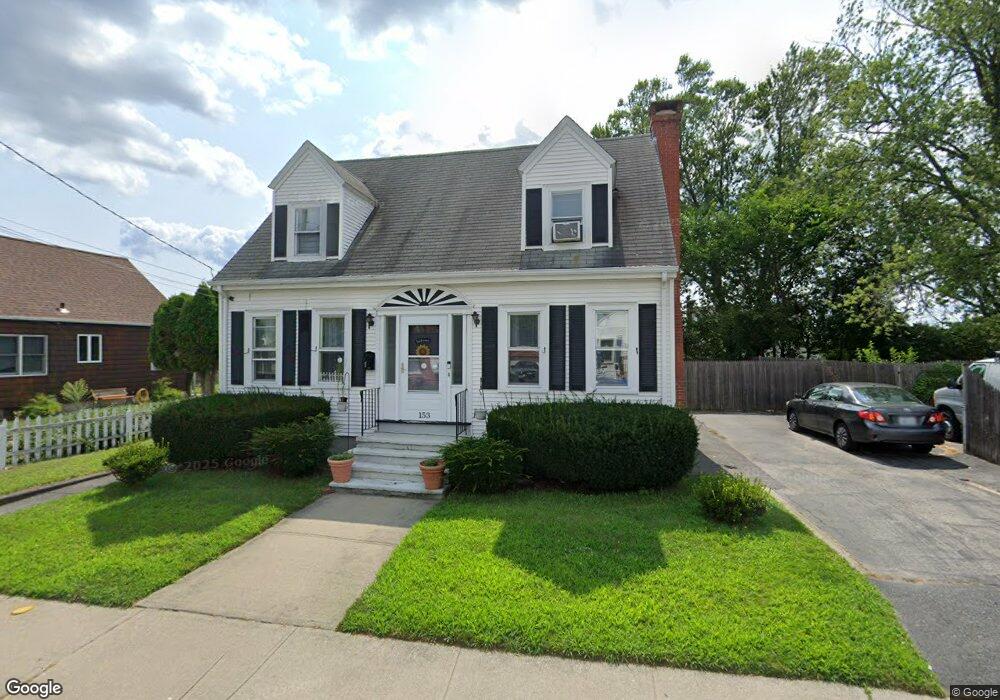
153 Crescent Ave Cranston, RI 02910
Stadium NeighborhoodEstimated Value: $369,000 - $419,000
3
Beds
2
Baths
1,272
Sq Ft
$311/Sq Ft
Est. Value
About This Home
This home is located at 153 Crescent Ave, Cranston, RI 02910 and is currently estimated at $395,137, approximately $310 per square foot. 153 Crescent Ave is a home located in Providence County with nearby schools including Stadium Elementary School, Hugh B. Bain Middle School, and Cranston High School East.
Ownership History
Date
Name
Owned For
Owner Type
Purchase Details
Closed on
Apr 9, 2021
Sold by
Blanco Ramon D and Torres Maria
Bought by
Torres Maria S
Current Estimated Value
Home Financials for this Owner
Home Financials are based on the most recent Mortgage that was taken out on this home.
Original Mortgage
$183,150
Outstanding Balance
$165,138
Interest Rate
3.05%
Mortgage Type
FHA
Estimated Equity
$229,999
Purchase Details
Closed on
Aug 31, 2007
Sold by
Bank Of New York
Bought by
Garcia Mario
Home Financials for this Owner
Home Financials are based on the most recent Mortgage that was taken out on this home.
Original Mortgage
$163,400
Interest Rate
6.71%
Mortgage Type
Purchase Money Mortgage
Purchase Details
Closed on
Mar 20, 2007
Sold by
Simon Nicole C
Bought by
Bank Of New York
Purchase Details
Closed on
Dec 1, 2005
Sold by
Maurice Shirley Ann and Hart Terence
Bought by
Simon Nicole C
Home Financials for this Owner
Home Financials are based on the most recent Mortgage that was taken out on this home.
Original Mortgage
$178,000
Interest Rate
6.14%
Mortgage Type
Purchase Money Mortgage
Create a Home Valuation Report for This Property
The Home Valuation Report is an in-depth analysis detailing your home's value as well as a comparison with similar homes in the area
Home Values in the Area
Average Home Value in this Area
Purchase History
| Date | Buyer | Sale Price | Title Company |
|---|---|---|---|
| Torres Maria S | -- | None Available | |
| Garcia Mario | $172,000 | -- | |
| Bank Of New York | $193,500 | -- | |
| Simon Nicole C | $222,500 | -- |
Source: Public Records
Mortgage History
| Date | Status | Borrower | Loan Amount |
|---|---|---|---|
| Open | Torres Maria S | $183,150 | |
| Previous Owner | Simon Nicole C | $164,000 | |
| Previous Owner | Simon Nicole C | $163,400 | |
| Previous Owner | Simon Nicole C | $178,000 |
Source: Public Records
Tax History Compared to Growth
Tax History
| Year | Tax Paid | Tax Assessment Tax Assessment Total Assessment is a certain percentage of the fair market value that is determined by local assessors to be the total taxable value of land and additions on the property. | Land | Improvement |
|---|---|---|---|---|
| 2025 | $4,503 | $324,400 | $96,600 | $227,800 |
| 2024 | $4,415 | $324,400 | $96,600 | $227,800 |
| 2023 | $4,294 | $227,200 | $66,600 | $160,600 |
| 2022 | $4,205 | $227,200 | $66,600 | $160,600 |
| 2021 | $4,090 | $227,200 | $66,600 | $160,600 |
| 2020 | $3,865 | $186,100 | $63,300 | $122,800 |
| 2019 | $3,865 | $186,100 | $63,300 | $122,800 |
| 2018 | $3,776 | $186,100 | $63,300 | $122,800 |
| 2017 | $3,186 | $138,900 | $46,600 | $92,300 |
| 2016 | $3,118 | $138,900 | $46,600 | $92,300 |
| 2015 | $3,118 | $138,900 | $46,600 | $92,300 |
| 2014 | $3,042 | $133,200 | $46,600 | $86,600 |
Source: Public Records
Map
Nearby Homes
- 143 Crescent Ave
- 159 Crescent Ave
- 131 Fiat Ave
- 139 Fiat Ave
- 150 Packard St
- 150 Crescent Ave
- 154 Crescent Ave
- 125 Fiat Ave
- 139 Crescent Ave
- 140 Crescent Ave
- 158 Crescent Ave
- 147 Fiat Ave
- 166 Crescent Ave
- 133 Crescent Ave
- 157 Harmon Ave
- 136 Crescent Ave
- 151 Fiat Ave
- 149 Harmon Ave
- 161 Harmon Ave
- 147 Packard St