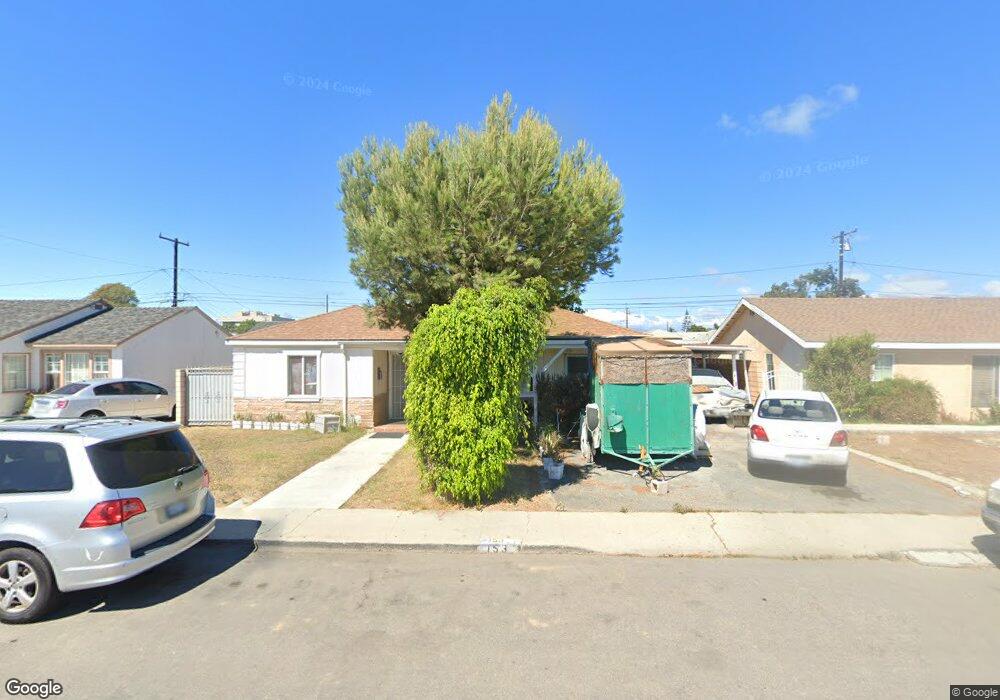
153 Hughes Dr Oxnard, CA 93033
Blackstock North NeighborhoodEstimated Value: $659,000 - $681,000
4
Beds
2
Baths
1,286
Sq Ft
$521/Sq Ft
Est. Value
About This Home
This home is located at 153 Hughes Dr, Oxnard, CA 93033 and is currently estimated at $669,766, approximately $520 per square foot. 153 Hughes Dr is a home located in Ventura County with nearby schools including Ansgar Larsen Elementary School, Channel Islands High School, and Santa Clara High School.
Ownership History
Date
Name
Owned For
Owner Type
Purchase Details
Closed on
Sep 6, 2016
Sold by
Talavera Saul Castanon
Bought by
Talavera Saul Castanon
Current Estimated Value
Purchase Details
Closed on
Apr 28, 2015
Sold by
Carbajal Corporation
Bought by
Talavera Saul Castanon
Home Financials for this Owner
Home Financials are based on the most recent Mortgage that was taken out on this home.
Original Mortgage
$284,000
Outstanding Balance
$219,180
Interest Rate
3.73%
Mortgage Type
New Conventional
Estimated Equity
$450,586
Purchase Details
Closed on
Jun 19, 2014
Sold by
Heredia Sharon K
Bought by
Carbajal Corporation
Purchase Details
Closed on
Oct 27, 1995
Sold by
Gales Claude and Gales Freda
Bought by
Gales Claude and Gales Freda
Create a Home Valuation Report for This Property
The Home Valuation Report is an in-depth analysis detailing your home's value as well as a comparison with similar homes in the area
Home Values in the Area
Average Home Value in this Area
Purchase History
| Date | Buyer | Sale Price | Title Company |
|---|---|---|---|
| Talavera Saul Castanon | -- | None Available | |
| Talavera Saul Castanon | $355,000 | Chicago Title Company | |
| Carbajal Corporation | $290,000 | First American Title Company | |
| Gales Claude | -- | Fidelity National Title |
Source: Public Records
Mortgage History
| Date | Status | Borrower | Loan Amount |
|---|---|---|---|
| Open | Talavera Saul Castanon | $284,000 |
Source: Public Records
Tax History
| Year | Tax Paid | Tax Assessment Tax Assessment Total Assessment is a certain percentage of the fair market value that is determined by local assessors to be the total taxable value of land and additions on the property. | Land | Improvement |
|---|---|---|---|---|
| 2025 | $5,057 | $426,648 | $277,623 | $149,025 |
| 2024 | $5,057 | $418,283 | $272,180 | $146,103 |
| 2023 | $4,772 | $410,082 | $266,843 | $143,239 |
| 2022 | $4,674 | $402,042 | $261,611 | $140,431 |
| 2021 | $4,733 | $394,159 | $256,481 | $137,678 |
| 2020 | $4,820 | $390,119 | $253,852 | $136,267 |
| 2019 | $4,675 | $382,471 | $248,875 | $133,596 |
| 2018 | $4,502 | $374,973 | $243,996 | $130,977 |
| 2017 | $4,356 | $367,621 | $239,212 | $128,409 |
| 2016 | $4,147 | $360,414 | $234,522 | $125,892 |
| 2015 | $3,446 | $290,000 | $188,500 | $101,500 |
| 2014 | -- | $115,945 | $40,572 | $75,373 |
Source: Public Records
Map
Nearby Homes
- 3631 La Costa Place
- 3130 Paula St
- 3638 S B St
- 360 Ibsen Place Unit 129
- 4160 Petit Dr Unit 39
- 320 Columbia Place Unit 46
- 1036 Cheyenne Way
- 4029 S B St
- 4200 S A St
- 3820 S J St
- 225 W Iris St
- 775 Thayer Ln
- 1140 Teakwood St
- 2024 S J St
- 4710 Clover Dr
- 4340 Highland Ave
- 505 Pearson Rd
- 4731 Hamilton Ave
- 1928 San Benito St
- 4200 Browning Dr
Your Personal Tour Guide
Ask me questions while you tour the home.