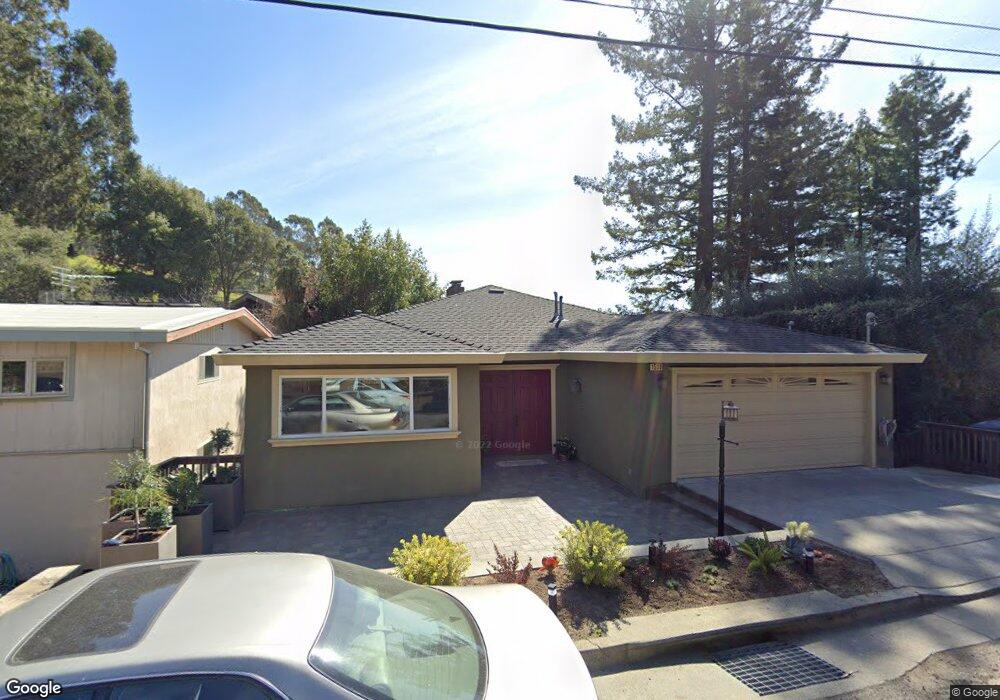
1530 Summit Rd Berkeley, CA 94708
Berkeley Hills NeighborhoodEstimated Value: $1,440,000 - $2,256,000
5
Beds
4
Baths
4,000
Sq Ft
$502/Sq Ft
Est. Value
About This Home
This home is located at 1530 Summit Rd, Berkeley, CA 94708 and is currently estimated at $2,009,408, approximately $502 per square foot. 1530 Summit Rd is a home located in Alameda County with nearby schools including Cragmont Elementary School, Berkeley Arts Magnet at Whittier School, and Washington Elementary School.
Ownership History
Date
Name
Owned For
Owner Type
Purchase Details
Closed on
Mar 11, 2019
Sold by
Tabatabaee Hashem K and Tabatabaee Hashem
Bought by
Tabatabaee Hashem K and Hashem Tabatabaee Trust
Current Estimated Value
Purchase Details
Closed on
Oct 20, 2008
Sold by
Tabatabaee Hashem K and Tabatabaee Ahmad K
Bought by
Tabatabaee Hashem K
Purchase Details
Closed on
Apr 16, 2007
Sold by
Valva Robert M and Estate Of Josephine H Cooper
Bought by
Tabatabaee Hashem K and Tabatabaee Ahmad K
Home Financials for this Owner
Home Financials are based on the most recent Mortgage that was taken out on this home.
Original Mortgage
$568,000
Outstanding Balance
$342,482
Interest Rate
6.1%
Mortgage Type
Purchase Money Mortgage
Estimated Equity
$1,666,926
Purchase Details
Closed on
Apr 30, 1965
Sold by
Chambers Bertha and Cooper John H
Bought by
Cooper John H and Cooper Josephine H
Create a Home Valuation Report for This Property
The Home Valuation Report is an in-depth analysis detailing your home's value as well as a comparison with similar homes in the area
Home Values in the Area
Average Home Value in this Area
Purchase History
| Date | Buyer | Sale Price | Title Company |
|---|---|---|---|
| Tabatabaee Hashem K | -- | Old Republic Title Company | |
| Tabatabaee Hashem K | -- | None Available | |
| Tabatabaee Hashem K | $710,000 | North American Title Co | |
| Cooper John H | -- | Accommodation |
Source: Public Records
Mortgage History
| Date | Status | Borrower | Loan Amount |
|---|---|---|---|
| Open | Tabatabaee Hashem K | $568,000 |
Source: Public Records
Tax History
| Year | Tax Paid | Tax Assessment Tax Assessment Total Assessment is a certain percentage of the fair market value that is determined by local assessors to be the total taxable value of land and additions on the property. | Land | Improvement |
|---|---|---|---|---|
| 2025 | $18,142 | $943,475 | $283,042 | $660,433 |
| 2024 | $18,142 | $924,981 | $277,494 | $647,487 |
| 2023 | $17,680 | $906,847 | $272,054 | $634,793 |
| 2022 | $17,229 | $889,070 | $266,721 | $622,349 |
| 2021 | $17,227 | $871,642 | $261,492 | $610,150 |
| 2020 | $16,106 | $862,707 | $258,812 | $603,895 |
| 2019 | $15,257 | $845,795 | $253,738 | $592,057 |
| 2018 | $14,693 | $829,217 | $248,765 | $580,452 |
| 2017 | $14,960 | $812,962 | $243,888 | $569,074 |
| 2016 | $13,336 | $797,026 | $239,108 | $557,918 |
| 2015 | $13,136 | $785,060 | $235,518 | $549,542 |
| 2014 | $12,987 | $769,687 | $230,906 | $538,781 |
Source: Public Records
Map
Nearby Homes
- 230 Fairlawn Dr
- 1375 Queens Rd
- 2893 Buena Vista Way
- 1221 Grizzly Peak Blvd
- 1698 La Loma Ave Unit 1698
- 2700 Le Conte Ave Unit 301
- 2700 Le Conte Ave Unit 402
- 2686 Shasta Rd
- 2600 Hilgard Ave
- 1179 Keith Ave
- 1160 Miller Ave
- 20 Stevenson Ave
- 1155 Keeler Ave
- 1165 Cragmont Ave
- 1110 Sterling Ave
- 2501 Rose Walk
- 39 Canyon Rd
- 1119 Miller Ave
- 2477 Virginia St
- 0 Panoramic Way Unit 41118724
- 1532 Summit Rd
- 1522 Summit Rd
- 1528 Summit Rd
- 1534 Summit Rd
- 1524 Summit Rd
- 1510 Grizzly Peak Blvd
- 1517 Summit Rd
- 1520 Summit Rd
- 1512 Grizzly Peak Blvd
- 1515 Summit Rd
- 1516 Grizzly Peak Blvd
- 1504 Grizzly Peak Blvd
- 1516 Summit Rd
- 1531 Summit Rd
- 1501 Summit Rd
- 1514 Summit Rd
- 1545 Summit Rd
- 1512 Summit Rd
- 8 Summit Ln
- 1510 Summit Rd
Your Personal Tour Guide
Ask me questions while you tour the home.