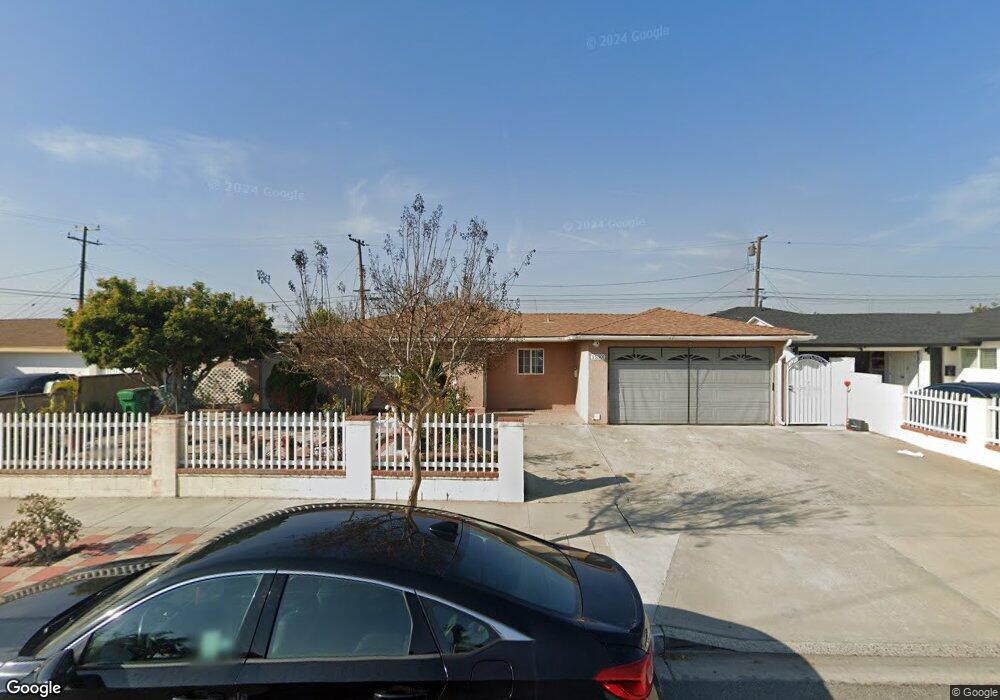
15301 Webster St Westminster, CA 92683
Star View NeighborhoodEstimated Value: $974,000 - $1,131,000
3
Beds
2
Baths
1,226
Sq Ft
$848/Sq Ft
Est. Value
About This Home
This home is located at 15301 Webster St, Westminster, CA 92683 and is currently estimated at $1,039,243, approximately $847 per square foot. 15301 Webster St is a home located in Orange County with nearby schools including Demille Elementary, Warner Middle, and Westminster High School.
Ownership History
Date
Name
Owned For
Owner Type
Purchase Details
Closed on
Feb 27, 2024
Sold by
Le Family Revocable Trust
Bought by
Le Kha Vu and Bui Karen Oanh
Current Estimated Value
Purchase Details
Closed on
Apr 6, 2022
Sold by
Le Family Revocable Trust
Bought by
Le Family Revocable Trust
Purchase Details
Closed on
Aug 26, 2003
Sold by
Vanvanle Thin Van and Vo Anh Thi
Bought by
Vanvanle Thin Van and Vo Anh Thi
Purchase Details
Closed on
Aug 21, 2000
Sold by
Van Le Thin and Thi Anh Thi
Bought by
Vanvanle Thin Van and Vo Anh Thi
Purchase Details
Closed on
Jun 11, 1997
Sold by
Willson Leland J and Willson Consuelo D
Bought by
Vanvanle Thin Van and Vo Anh Thi
Home Financials for this Owner
Home Financials are based on the most recent Mortgage that was taken out on this home.
Original Mortgage
$140,000
Interest Rate
7.58%
Create a Home Valuation Report for This Property
The Home Valuation Report is an in-depth analysis detailing your home's value as well as a comparison with similar homes in the area
Home Values in the Area
Average Home Value in this Area
Purchase History
| Date | Buyer | Sale Price | Title Company |
|---|---|---|---|
| Le Kha Vu | -- | None Listed On Document | |
| Le Family Revocable Trust | -- | New Title Company Name | |
| Vanvanle Thin Van | -- | -- | |
| Vanvanle Thin Van | -- | -- | |
| Vanvanle Thin Van | $147,500 | Fidelity National Title |
Source: Public Records
Mortgage History
| Date | Status | Borrower | Loan Amount |
|---|---|---|---|
| Previous Owner | Vanvanle Thin Van | $140,000 |
Source: Public Records
Tax History Compared to Growth
Tax History
| Year | Tax Paid | Tax Assessment Tax Assessment Total Assessment is a certain percentage of the fair market value that is determined by local assessors to be the total taxable value of land and additions on the property. | Land | Improvement |
|---|---|---|---|---|
| 2025 | $6,589 | $296,262 | $230,139 | $66,123 |
| 2024 | $6,589 | $530,175 | $466,312 | $63,863 |
| 2023 | $3,717 | $284,758 | $221,202 | $63,556 |
| 2022 | $3,653 | $279,175 | $216,865 | $62,310 |
| 2021 | $3,557 | $273,701 | $212,612 | $61,089 |
| 2020 | $3,517 | $270,895 | $210,432 | $60,463 |
| 2019 | $3,480 | $265,584 | $206,306 | $59,278 |
| 2018 | $3,477 | $260,377 | $202,261 | $58,116 |
| 2017 | $3,354 | $255,272 | $198,295 | $56,977 |
| 2016 | $3,256 | $250,267 | $194,407 | $55,860 |
| 2015 | $3,202 | $246,508 | $191,487 | $55,021 |
| 2014 | $3,133 | $241,680 | $187,736 | $53,944 |
Source: Public Records
Map
Nearby Homes
- 15300 Magnolia St Unit 71
- 15110 Henley Dr Unit 51
- 8822 Palos Verdes Ave
- 8961 Emerald Ave
- 8862 Ovieda Plaza
- 9190 Poppy Cir
- 14892 Valencia Plaza
- 8331 Gumwood Cir
- 15690 Poinsettia Way
- 8200 Bolsa Ave Unit 2
- 8200 Bolsa Ave Unit 42
- 15710 Poinsettia Way
- 8200 Bosa Ave Unit 92
- 8200 Bolsa Ave Spc#146
- 14702 Purdy St
- 8206 Maureen Dr Unit 16
- 14721 Riata St
- 14642 Birch St
- 14712 Newland St
- 15081 Van Buren St
- 15291 Webster St
- 15321 Webster St
- 15292 Neece St
- 8842 Bishop Ave
- 15282 Neece St
- 15271 Webster St
- 8871 Pacheco Ave
- 8861 Pacheco Ave
- 15312 Webster St
- 8901 Bishop Ave
- 8832 Bishop Ave
- 15272 Neece St
- 15322 Webster St
- 8851 Pacheco Ave
- 15251 Webster St
- 8831 Pacheco Ave
- 8911 Bishop Ave
- 15342 Webster St
- 15252 Neece St
- 8822 Bishop Ave