1531 Sleeping Indian Rd Oceanside, CA 92057
South Morro Hills NeighborhoodEstimated Value: $1,415,000 - $1,806,000
About This Home
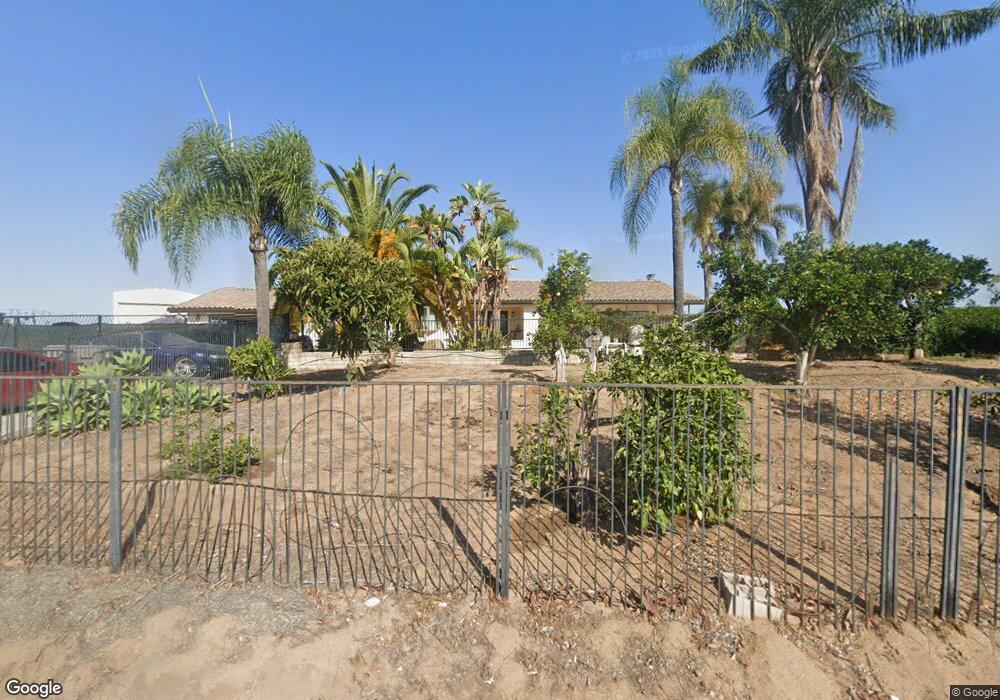
This home is located at 1531 Sleeping Indian Rd, Oceanside, CA 92057 and is currently estimated at $1,641,247, approximately $279 per square foot. 1531 Sleeping Indian Rd is a home located in San Diego County with nearby schools including Bonsall Elementary School, Sullivan Middle School, and Bonsall High.
Ownership History
We collect this data history from publicly available records. To have your information removed, we recommend requesting removal directly through your county’s website.
Purchase Details
Purchase Details
Home Financials for this Owner
Home Financials are based on the most recent Mortgage that was taken out on this home.Purchase Details
Home Financials for this Owner
Home Financials are based on the most recent Mortgage that was taken out on this home.Purchase Details
Purchase Details
Purchase Details
Home Financials for this Owner
Home Financials are based on the most recent Mortgage that was taken out on this home.Purchase Details
Home Financials for this Owner
Home Financials are based on the most recent Mortgage that was taken out on this home.Purchase Details
Purchase Details
Purchase Details
Purchase Details
Purchase Details
Home Financials for this Owner
Home Financials are based on the most recent Mortgage that was taken out on this home.Home Values in the Area
Average Home Value in this Area
Purchase History
We collect this data history from publicly available records. To have your information removed, we recommend requesting removal directly through your county’s website.
| Date | Buyer | Sale Price | Title Company |
|---|---|---|---|
| $1,100,000 | Fidelity National Title | ||
| $578,000 | Ticor Title Company Of Ca | ||
| $532,870 | Accommodation | ||
| -- | -- | ||
| -- | -- | ||
| -- | -- | ||
| -- | -- | ||
| -- | First American Title | ||
| $1,110,000 | First American Title | ||
| -- | -- | ||
| -- | -- | ||
| -- | First Southwestern Title Co | ||
| -- | First Southwestern Title Co | ||
| -- | -- | ||
| -- | First American Title | ||
| $539,000 | First American Title |
Mortgage History
We collect this data history from publicly available records. To have your information removed, we recommend requesting removal directly through your county’s website.
| Date | Status | Borrower | Loan Amount |
|---|---|---|---|
| Previous Owner | $520,100 | ||
| Previous Owner | $700,000 | ||
| Previous Owner | $400,000 | ||
| Closed | $199,000 |
Tax History
We collect this data history from publicly available records. To have your information removed, we recommend requesting removal directly through your county’s website.
| Year | Tax Paid | Tax Assessment Tax Assessment Total Assessment is a certain percentage of the fair market value that is determined by local assessors to be the total taxable value of land and additions on the property. | Land | Improvement |
|---|---|---|---|---|
| 2025 | $12,037 | $1,167,328 | $679,173 | $488,155 |
| 2024 | $12,037 | $1,144,440 | $665,856 | $478,584 |
| 2023 | $11,774 | $1,122,000 | $652,800 | $469,200 |
| 2022 | $11,574 | $1,100,000 | $640,000 | $460,000 |
| 2021 | $7,101 | $670,705 | $322,588 | $348,117 |
| 2020 | $7,045 | $663,829 | $319,281 | $344,548 |
| 2019 | $6,913 | $650,814 | $313,021 | $337,793 |
| 2018 | $6,949 | $638,054 | $306,884 | $331,170 |
| 2017 | $71 | $625,544 | $300,867 | $324,677 |
| 2016 | $6,655 | $613,279 | $294,968 | $318,311 |
| 2015 | $6,552 | $604,068 | $290,538 | $313,530 |
| 2014 | $6,422 | $592,236 | $284,847 | $307,389 |
Map
- 1560 Camino Corto
- 6542 Indian Trail Way
- 5012 Sleeping Indian Rd
- 3918 Valle Del Sol
- 4712 Briana Ct
- 0 Vía Rancho Del Lago
- 456 Grove View Rd
- 5544 Papagallo Dr
- 4709 Briana Ct
- 4236 Valle Del Sol
- 2105 Timneh Ct
- 5530 Papagallo Dr
- 712 Sleeping Indian Rd
- 1022 Straightaway Ct
- 310 Highland Oaks Ct
- 5 Country Glen Rd
- 8 Country Glen Rd
- 5104 Olive Hill Trail
- 19 Gateview Dr
- 5450 Alexandrine Ct
- 1541 Sleeping Indian Rd
- 1529 Sleeping Indian Rd
- 1527 Sleeping Indian Rd
- 1525 Sleeping Indian Rd
- 1537 Sleeping Indian Rd
- 1539 Sleeping Indian Rd
- 1531 Sleeping Indian Rd
- 0 Sleeping Indian Rd Unit 6
- 1548 Sleeping Indian Rd
- 6608 Puerta de Lomas
- 1544 Sleeping Indian Rd
- 6608 Puerta de Lomas
- 6699 Morro Heights Rd
- 1549 Sleeping Indian Rd
- 1515 Sleeping Indian Rd
- 1540 Wilshire Rd
- 1510 Wilshire Rd
- 6628 Puerta de Lomas
- 6693 Morro Heights Rd
- 1555 Sleeping Indian Rd
Ask me questions while you tour the home.