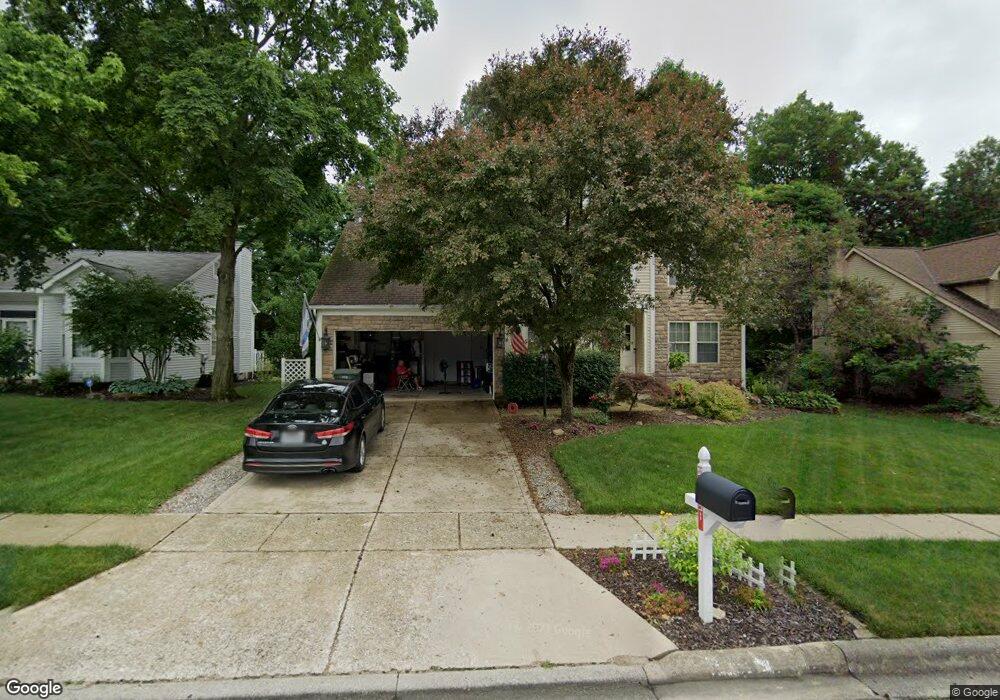
1531 Vanelm St Columbus, OH 43228
Scioto Woods NeighborhoodEstimated Value: $439,000 - $482,000
4
Beds
3
Baths
2,415
Sq Ft
$189/Sq Ft
Est. Value
About This Home
This home is located at 1531 Vanelm St, Columbus, OH 43228 and is currently estimated at $455,816, approximately $188 per square foot. 1531 Vanelm St is a home located in Franklin County with nearby schools including Galloway Ridge Intermediate School, Prairie Lincoln Elementary School, and Norton Middle School.
Ownership History
Date
Name
Owned For
Owner Type
Purchase Details
Closed on
Dec 13, 2010
Sold by
Fannie Mae
Bought by
Barber Lauren
Current Estimated Value
Home Financials for this Owner
Home Financials are based on the most recent Mortgage that was taken out on this home.
Original Mortgage
$151,070
Interest Rate
4.84%
Mortgage Type
FHA
Purchase Details
Closed on
Jul 29, 2010
Sold by
Malleske Mollie and Malleske Daniel T
Bought by
Federal National Mortgage Association
Purchase Details
Closed on
Jul 13, 2005
Sold by
Guise Dittie F
Bought by
Malleske Daniel T and Malleske Mollie
Home Financials for this Owner
Home Financials are based on the most recent Mortgage that was taken out on this home.
Original Mortgage
$176,000
Interest Rate
5.37%
Mortgage Type
Fannie Mae Freddie Mac
Purchase Details
Closed on
Aug 30, 1993
Bought by
Guise Dittie F
Purchase Details
Closed on
Jul 9, 1991
Create a Home Valuation Report for This Property
The Home Valuation Report is an in-depth analysis detailing your home's value as well as a comparison with similar homes in the area
Home Values in the Area
Average Home Value in this Area
Purchase History
| Date | Buyer | Sale Price | Title Company |
|---|---|---|---|
| Barber Lauren | $155,000 | Accutitle Agency Inc | |
| Federal National Mortgage Association | $140,000 | None Available | |
| Malleske Daniel T | $220,000 | -- | |
| Guise Dittie F | $155,700 | -- | |
| -- | -- | -- |
Source: Public Records
Mortgage History
| Date | Status | Borrower | Loan Amount |
|---|---|---|---|
| Previous Owner | Barber Lauren | $151,070 | |
| Previous Owner | Malleske Daniel T | $176,000 | |
| Closed | Malleske Daniel T | $22,000 |
Source: Public Records
Tax History Compared to Growth
Tax History
| Year | Tax Paid | Tax Assessment Tax Assessment Total Assessment is a certain percentage of the fair market value that is determined by local assessors to be the total taxable value of land and additions on the property. | Land | Improvement |
|---|---|---|---|---|
| 2024 | $4,942 | $135,530 | $41,760 | $93,770 |
| 2023 | $5,099 | $135,520 | $41,755 | $93,765 |
| 2022 | $4,756 | $97,440 | $18,130 | $79,310 |
| 2021 | $5,153 | $97,440 | $18,130 | $79,310 |
| 2020 | $4,915 | $97,440 | $18,130 | $79,310 |
| 2019 | $4,357 | $77,670 | $14,490 | $63,180 |
| 2018 | $4,158 | $77,670 | $14,490 | $63,180 |
| 2017 | $4,148 | $77,670 | $14,490 | $63,180 |
| 2016 | $3,979 | $65,770 | $14,670 | $51,100 |
| 2015 | $3,979 | $65,770 | $14,670 | $51,100 |
| 2014 | $3,983 | $65,770 | $14,670 | $51,100 |
| 2013 | $1,975 | $65,765 | $14,665 | $51,100 |
Source: Public Records
Map
Nearby Homes
- 3664 Grimes Dr
- 3757 Gibbstone Dr
- 3761 Gibbstone Dr
- 3495 La Coste Ln
- 4000 Sandy Ridge Dr
- 3570 Dover Rd
- 2051 Tuckaway Ct
- 3254 Dover Rd
- 3252 Dover Rd
- 3161 Bowdoin Cir
- 1150 Romona Place
- 0 Lowell Dr Unit 223009270
- 4451 Sherwill Rd
- 2350 Hetter St
- 664 N Wilson Rd
- 3307 Rudon Ln
- 2754 Scioto Station Dr
- 2704 Scioto Station Dr Unit 2704
- 2875 Lowell Dr
- 2867 Kobuk Dr Unit 404
- 1523 Vanelm St
- 1543 Vanelm St
- 1515 Vanelm St
- 1542 Vanelm St
- 1528 Vanelm St
- 1507 Vanelm St
- 1560 Vanelm St
- 3725 Collet Ct
- 3712 Collet Ct
- 3717 Collet Ct
- 3744 Newell Dr
- 3752 Newell Dr
- 1567 Vanelm St
- 1568 Vanelm St
- 1539 Mcspaden Ct
- 3718 Newell Dr
- 3760 Newell Dr
- 1544 Mcspaden Ct
- 3700 Collet Ct
- 3710 Newell Dr