Estimated Value: $183,000 - $236,303
3
Beds
2
Baths
1,944
Sq Ft
$108/Sq Ft
Est. Value
About This Home
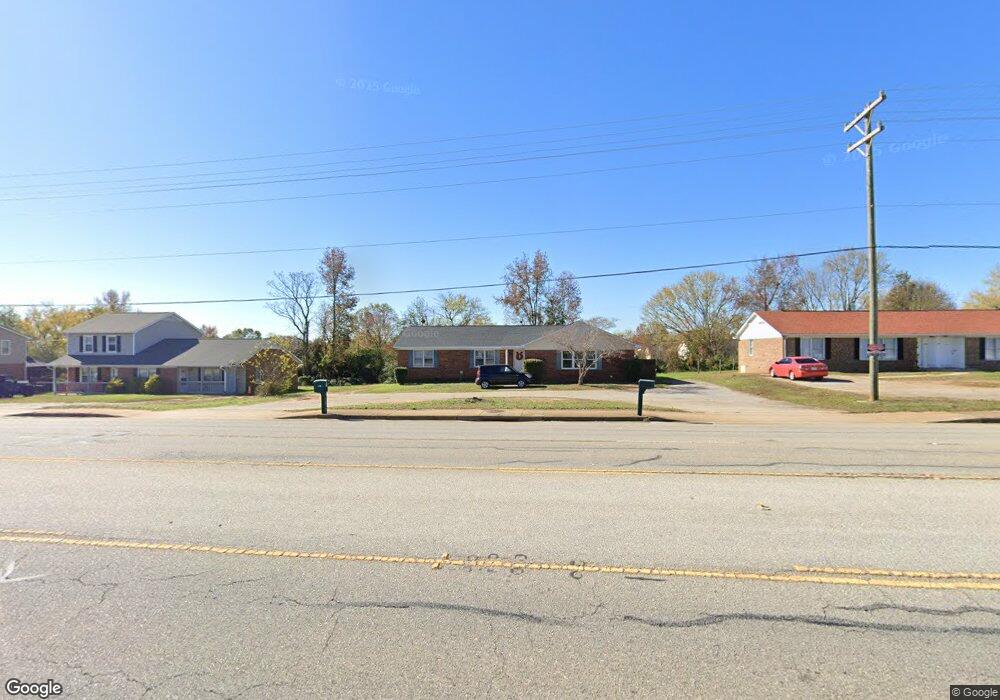
This home is located at 1532 E Blackstock Rd, Moore, SC 29369 and is currently estimated at $210,576, approximately $108 per square foot. 1532 E Blackstock Rd is a home located in Spartanburg County with nearby schools including Dorman High School Freshman Campus, Dorman High School, and Westgate Christian School.
Ownership History
Date
Name
Owned For
Owner Type
Purchase Details
Closed on
Oct 27, 2023
Sold by
Kirsch Mitzi
Bought by
Cm3 Properties Llc
Current Estimated Value
Home Financials for this Owner
Home Financials are based on the most recent Mortgage that was taken out on this home.
Original Mortgage
$143,250
Outstanding Balance
$140,406
Interest Rate
7.31%
Estimated Equity
$70,170
Purchase Details
Closed on
Sep 29, 2023
Sold by
Mitchell Jonathan D
Bought by
Kirsch Mitzi
Home Financials for this Owner
Home Financials are based on the most recent Mortgage that was taken out on this home.
Original Mortgage
$143,250
Outstanding Balance
$140,406
Interest Rate
7.31%
Estimated Equity
$70,170
Purchase Details
Closed on
Apr 30, 2002
Sold by
Mccorkle Cavert K and Burns Charles
Bought by
Mitchell Jonathan D
Create a Home Valuation Report for This Property
The Home Valuation Report is an in-depth analysis detailing your home's value as well as a comparison with similar homes in the area
Home Values in the Area
Average Home Value in this Area
Purchase History
| Date | Buyer | Sale Price | Title Company |
|---|---|---|---|
| Cm3 Properties Llc | -- | None Listed On Document | |
| Kirsch Mitzi | $191,000 | None Listed On Document | |
| Kirsch Mitzi | $191,000 | None Listed On Document | |
| Mitchell Jonathan D | $95,000 | -- |
Source: Public Records
Mortgage History
| Date | Status | Borrower | Loan Amount |
|---|---|---|---|
| Open | Kirsch Mitzi | $143,250 | |
| Closed | Kirsch Mitzi | $143,250 |
Source: Public Records
Tax History Compared to Growth
Tax History
| Year | Tax Paid | Tax Assessment Tax Assessment Total Assessment is a certain percentage of the fair market value that is determined by local assessors to be the total taxable value of land and additions on the property. | Land | Improvement |
|---|---|---|---|---|
| 2025 | $4,246 | $11,460 | $1,782 | $9,678 |
| 2024 | $4,246 | $11,460 | $1,782 | $9,678 |
| 2023 | $4,246 | $5,420 | $927 | $4,493 |
| 2022 | $1,902 | $4,713 | $1,074 | $3,639 |
| 2021 | $1,883 | $4,713 | $1,074 | $3,639 |
| 2020 | $1,860 | $4,713 | $1,074 | $3,639 |
| 2019 | $1,836 | $4,713 | $1,074 | $3,639 |
| 2018 | $1,836 | $4,713 | $1,074 | $3,639 |
| 2017 | $1,584 | $4,098 | $1,080 | $3,018 |
| 2016 | $1,588 | $4,098 | $1,080 | $3,018 |
| 2015 | $1,552 | $4,098 | $1,080 | $3,018 |
| 2014 | $1,510 | $4,098 | $1,080 | $3,018 |
Source: Public Records
Map
Nearby Homes
- 2708 Millhone Dr
- Wellford Plan at Hampshire Heights
- Reynolds Plan at Hampshire Heights
- Quincy Plan at Hampshire Heights
- Pacific Plan at Hampshire Heights
- Inman Plan at Hampshire Heights
- Heatherwood Plan at Hampshire Heights
- Clifton Plan at Hampshire Heights
- Bishop Plan at Hampshire Heights
- Bethany Plan at Hampshire Heights
- Josie Plan at Hampshire Heights
- Huntington Plan at Hampshire Heights
- Gibson Plan at Hampshire Heights
- Weston (Revised) Plan at Hampshire Heights
- Dakota Plan at Hampshire Heights
- Sullivan Plan at Hampshire Heights
- Maddison Plan at Hampshire Heights
- Chelsie Plan at Hampshire Heights
- Astoria (Revised) Plan at Hampshire Heights
- Atwood Plan at Hampshire Heights
- 1528 E Blackstock Rd
- 1536 E Blackstock Rd
- 107 Churchill Ave
- 1524 E Blackstock Rd
- 1540 E Blackstock Rd
- 109 Churchill Ave
- 105 Churchill Ave
- 2704 Millhone Dr
- 111 Churchill Ave
- 1520 E Blackstock Rd Unit A
- 1520 E Blackstock Rd
- 103 Churchill Ave
- 1544 E Blackstock Rd Unit A
- 420 Sante fe Rd
- 2712 Millhone Dr
- 422 Sante fe Rd
- 418 Sante fe Rd
- 418 Sante fe Rd
- 101 Churchill Ave
- 2716 Millhone Dr