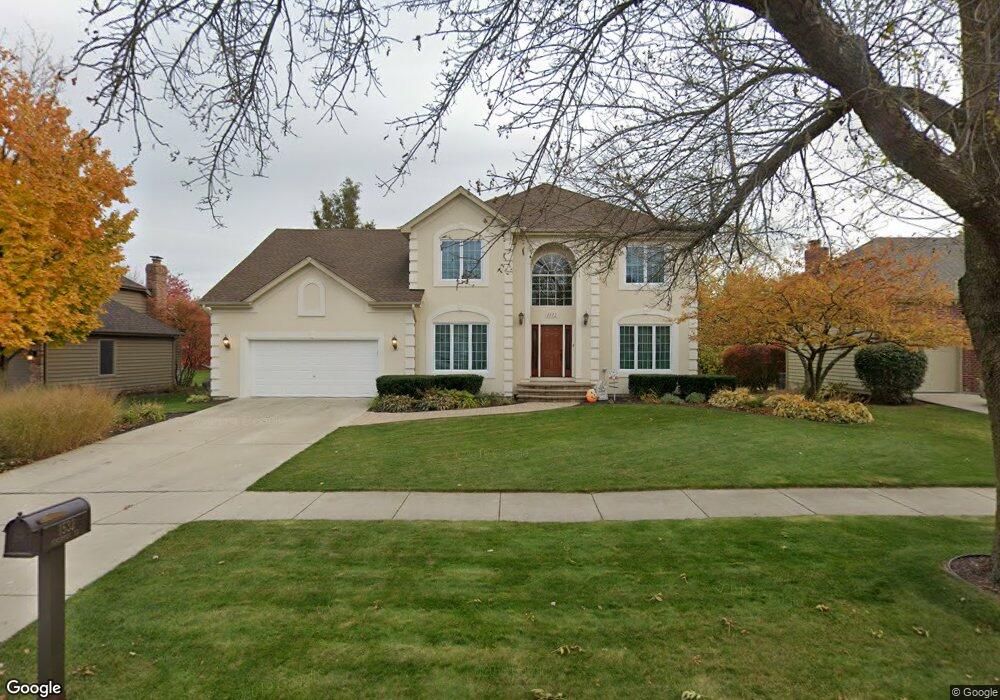
1532 Grommon Rd Naperville, IL 60564
Ashbury NeighborhoodEstimated Value: $733,434 - $837,000
--
Bed
1
Bath
3,113
Sq Ft
$248/Sq Ft
Est. Value
About This Home
This home is located at 1532 Grommon Rd, Naperville, IL 60564 and is currently estimated at $772,109, approximately $248 per square foot. 1532 Grommon Rd is a home located in Will County with nearby schools including Ellsworth Elementary School, Gordon Gregory Middle School, and Neuqua Valley High School.
Ownership History
Date
Name
Owned For
Owner Type
Purchase Details
Closed on
Oct 23, 1998
Sold by
Douglas H Lee and Douglas Barbara R
Bought by
Senn Thomas J and Senn Lisa O
Current Estimated Value
Home Financials for this Owner
Home Financials are based on the most recent Mortgage that was taken out on this home.
Original Mortgage
$140,000
Interest Rate
6.68%
Purchase Details
Closed on
Aug 10, 1995
Sold by
Brittany Homes Inc
Bought by
Douglas H Lee and Douglas Barbara R
Home Financials for this Owner
Home Financials are based on the most recent Mortgage that was taken out on this home.
Original Mortgage
$241,950
Interest Rate
7.64%
Purchase Details
Closed on
Aug 1, 1994
Sold by
Midamerica Development Services Inc
Bought by
Brittany Homes Inc
Home Financials for this Owner
Home Financials are based on the most recent Mortgage that was taken out on this home.
Original Mortgage
$57,200
Interest Rate
8.91%
Mortgage Type
Construction
Create a Home Valuation Report for This Property
The Home Valuation Report is an in-depth analysis detailing your home's value as well as a comparison with similar homes in the area
Home Values in the Area
Average Home Value in this Area
Purchase History
| Date | Buyer | Sale Price | Title Company |
|---|---|---|---|
| Senn Thomas J | $337,500 | -- | |
| Douglas H Lee | $295,500 | Chicago Title Insurance Co | |
| Brittany Homes Inc | $71,500 | Chicago Title Insurance Co |
Source: Public Records
Mortgage History
| Date | Status | Borrower | Loan Amount |
|---|---|---|---|
| Closed | Senn Thomas J | $140,000 | |
| Previous Owner | Douglas H Lee | $241,950 | |
| Previous Owner | Brittany Homes Inc | $57,200 |
Source: Public Records
Tax History Compared to Growth
Tax History
| Year | Tax Paid | Tax Assessment Tax Assessment Total Assessment is a certain percentage of the fair market value that is determined by local assessors to be the total taxable value of land and additions on the property. | Land | Improvement |
|---|---|---|---|---|
| 2024 | $12,837 | $211,982 | $65,131 | $146,851 |
| 2023 | $12,837 | $187,263 | $57,536 | $129,727 |
| 2022 | $11,980 | $176,344 | $54,428 | $121,916 |
| 2021 | $11,432 | $167,946 | $51,836 | $116,110 |
| 2020 | $11,209 | $165,285 | $51,015 | $114,270 |
| 2019 | $11,006 | $160,627 | $49,577 | $111,050 |
| 2018 | $10,905 | $156,575 | $48,487 | $108,088 |
| 2017 | $10,728 | $152,533 | $47,235 | $105,298 |
| 2016 | $11,087 | $149,249 | $46,218 | $103,031 |
| 2015 | $11,361 | $143,508 | $44,440 | $99,068 |
| 2014 | $11,361 | $141,847 | $44,440 | $97,407 |
| 2013 | $11,361 | $141,847 | $44,440 | $97,407 |
Source: Public Records
Map
Nearby Homes
- 3616 Eliot Ln
- 1804 Princess Cir
- 1112 Saratoga Ct
- 3432 Caine Dr
- 3816 Rosada Dr
- 1736 Robert Ln
- 1116 Hollingswood Ave
- 3212 Austin Ct
- 3508 Tussell St
- 2255 Wendt Cir
- 29W316 Andermann Dr
- 3004 Bennett Dr
- 2949 Brossman St
- 945 Winners Cup Ct Unit 945
- 4007 Heron Ct Unit 1
- 1123 Thackery Ln
- 2741 Gateshead Dr
- 1987 Baldwin Way
- 2207 Sisters Ave
- 164 Willow Bend
- 1528 Grommon Rd
- 1536 Grommon Rd
- 1523 Branford Ln
- 1519 Branford Ln Unit 8
- 1527 Branford Ln
- 1604 Grommon Rd
- 1531 Grommon Rd
- 1515 Branford Ln
- 1535 Grommon Rd
- 1531 Branford Ln
- 1527 Grommon Rd
- 1520 Grommon Rd Unit 8
- 1608 Grommon Rd
- 1523 Grommon Rd
- 1535 Branford Ln
- 1511 Branford Ln
- 1516 Branford Ln
- 1607 Grommon Rd
- 1524 Branford Ln
- 1516 Grommon Rd