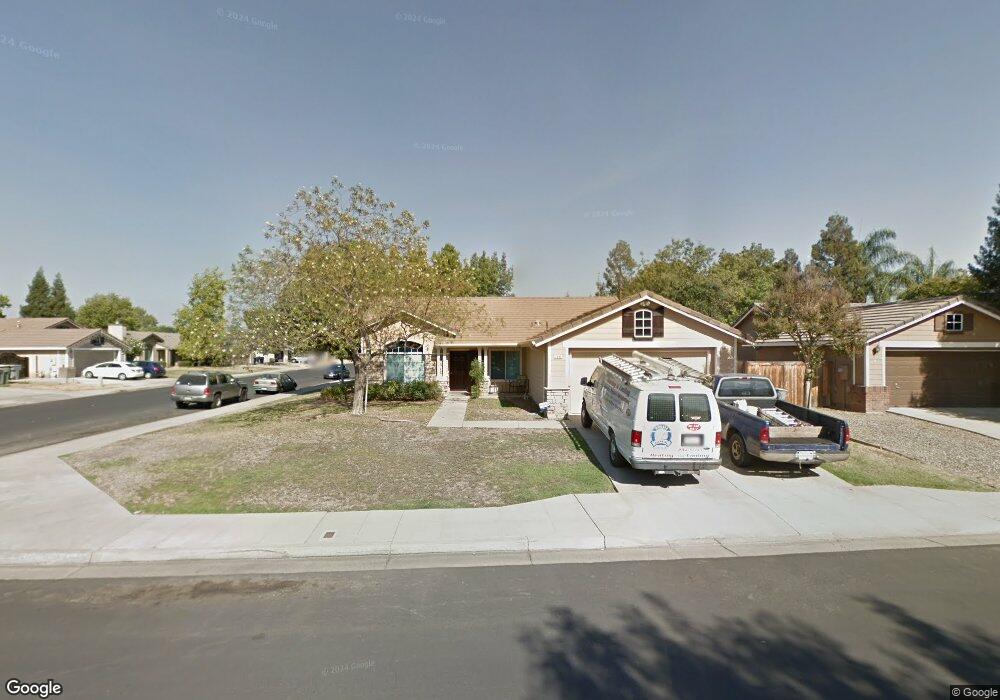
1533 Hanson Ave Clovis, CA 93611
Estimated Value: $412,762 - $439,000
4
Beds
2
Baths
1,494
Sq Ft
$285/Sq Ft
Est. Value
About This Home
This home is located at 1533 Hanson Ave, Clovis, CA 93611 and is currently estimated at $425,191, approximately $284 per square foot. 1533 Hanson Ave is a home located in Fresno County with nearby schools including Red Bank Elementary School, Clark Intermediate School, and Clovis High School.
Ownership History
Date
Name
Owned For
Owner Type
Purchase Details
Closed on
Jun 25, 2021
Sold by
Hopelian Jackie L and The Hopelian Family Trust
Bought by
Thompson William and Thompson Daniele
Current Estimated Value
Purchase Details
Closed on
Jun 25, 2007
Sold by
Hopelian George M
Bought by
Hopelian George M and The Hopelian Family Trust
Purchase Details
Closed on
Jul 16, 2002
Sold by
Hopelian Dennis A
Bought by
Hopelian George M
Purchase Details
Closed on
Nov 9, 1998
Sold by
Point Rosina and Rosina
Bought by
Hopelian Rosina and Hopelian Dennis A
Purchase Details
Closed on
Jan 28, 1998
Sold by
Bray Benny B
Bought by
Hopelian Rosina
Purchase Details
Closed on
Aug 22, 1994
Sold by
Kaufman & Broad Of Fresno Inc
Bought by
Bray Benny B
Home Financials for this Owner
Home Financials are based on the most recent Mortgage that was taken out on this home.
Original Mortgage
$120,222
Interest Rate
8.86%
Mortgage Type
Assumption
Create a Home Valuation Report for This Property
The Home Valuation Report is an in-depth analysis detailing your home's value as well as a comparison with similar homes in the area
Home Values in the Area
Average Home Value in this Area
Purchase History
| Date | Buyer | Sale Price | Title Company |
|---|---|---|---|
| Thompson William | -- | Fidelity National Title | |
| Hopelian George M | -- | None Available | |
| Hopelian George M | -- | -- | |
| Hopelian Rosina | -- | -- | |
| Hopelian Rosina | $106,000 | Commonwealth Land Title Ins | |
| Bray Benny B | $118,000 | First American Title Co |
Source: Public Records
Mortgage History
| Date | Status | Borrower | Loan Amount |
|---|---|---|---|
| Previous Owner | Bray Benny B | $120,222 |
Source: Public Records
Tax History
| Year | Tax Paid | Tax Assessment Tax Assessment Total Assessment is a certain percentage of the fair market value that is determined by local assessors to be the total taxable value of land and additions on the property. | Land | Improvement |
|---|---|---|---|---|
| 2025 | $2,648 | $209,522 | $70,676 | $138,846 |
| 2023 | $2,539 | $201,388 | $67,933 | $133,455 |
| 2022 | $2,508 | $197,440 | $66,601 | $130,839 |
| 2021 | $2,442 | $193,570 | $65,296 | $128,274 |
| 2020 | $2,433 | $191,586 | $64,627 | $126,959 |
| 2019 | $2,389 | $187,830 | $63,360 | $124,470 |
| 2018 | $2,340 | $184,148 | $62,118 | $122,030 |
| 2017 | $2,290 | $180,538 | $60,900 | $119,638 |
| 2016 | $2,218 | $176,999 | $59,706 | $117,293 |
| 2015 | $2,186 | $174,342 | $58,810 | $115,532 |
| 2014 | $2,148 | $170,927 | $57,658 | $113,269 |
Source: Public Records
Map
Nearby Homes
- 2668 Scott Ave
- 2703 Mitchell Ave
- 2549 Purvis Ave
- 2518 Keats Ave
- 2681 Wrenwood Ave
- 2222 Carson Ave
- 2669 Alamos Ave
- 2871 Wrenwood Ave
- 793 Applegate Ave
- 3045 Keats Ave
- 2963 Finchwood Ave
- 865 McKelvy Ave
- 2658 Santa Ana Ave
- 2337 Wrenwood Ave
- 2691 Morris Ave
- 3154 Mitchell Ave
- 1524 Burl Ave
- 2143 Lombard Ln
- 2318 Lombard Ln
- 1718 Ash Ave
- 1553 Hanson Ave
- 2656 Beverly Ave
- 1573 Hanson Ave
- 2635 Beverly Ave
- 2668 Beverly Ave
- 2655 Beverly Ave
- 1534 Hanson Ave
- 1554 Hanson Ave
- 1514 Hanson Ave
- 2667 San Jose Ave
- 1574 Hanson Ave
- 2665 Beverly Ave
- 1593 Hanson Ave
- 1484 Hanson Ave
- 2676 Beverly Ave
- 2657 San Jose Ave
- 2634 Dennis Ave
- 1594 Hanson Ave
- 2654 Dennis Ave
- 2677 San Jose Ave
Your Personal Tour Guide
Ask me questions while you tour the home.