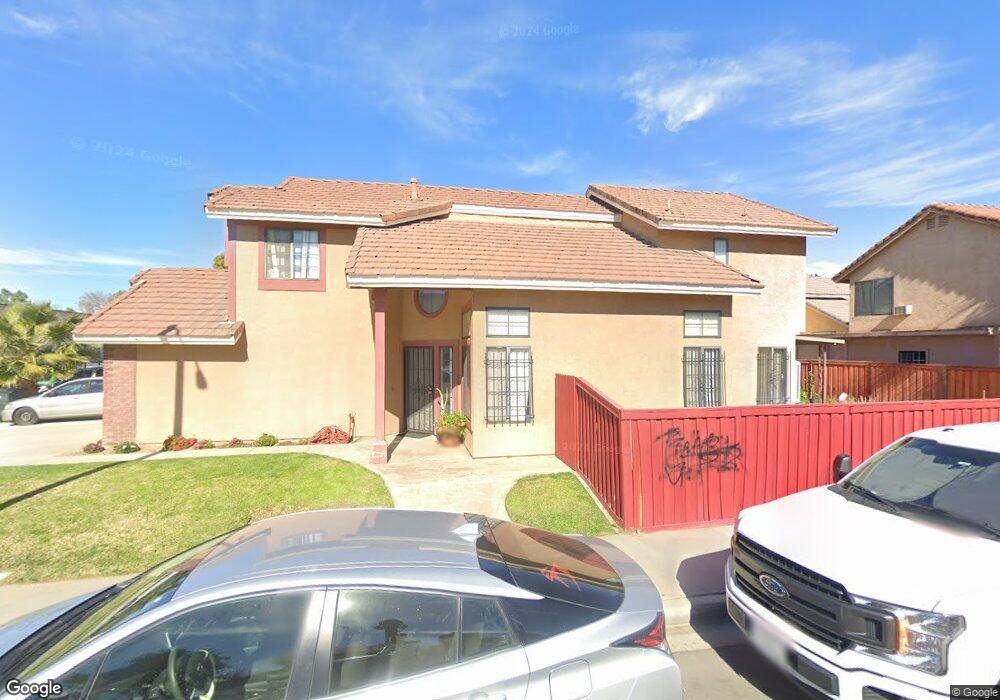
1533 Ruby Dr Perris, CA 92571
Central Perris NeighborhoodEstimated Value: $442,000 - $521,000
4
Beds
3
Baths
1,749
Sq Ft
$282/Sq Ft
Est. Value
About This Home
This home is located at 1533 Ruby Dr, Perris, CA 92571 and is currently estimated at $492,981, approximately $281 per square foot. 1533 Ruby Dr is a home located in Riverside County with nearby schools including Palms Elementary School, Pinacate Middle School, and Perris High School.
Ownership History
Date
Name
Owned For
Owner Type
Purchase Details
Closed on
May 25, 2021
Sold by
Chacon Milagro Minero and Goranov Milagro M
Bought by
Chacon Milagro Minero
Current Estimated Value
Home Financials for this Owner
Home Financials are based on the most recent Mortgage that was taken out on this home.
Original Mortgage
$109,000
Outstanding Balance
$80,561
Interest Rate
2.9%
Mortgage Type
New Conventional
Estimated Equity
$412,420
Purchase Details
Closed on
Mar 8, 2006
Sold by
Goranov Milagro M and Goranov Krassimir T
Bought by
Goranov Milagro M
Home Financials for this Owner
Home Financials are based on the most recent Mortgage that was taken out on this home.
Original Mortgage
$163,465
Interest Rate
6.19%
Mortgage Type
New Conventional
Purchase Details
Closed on
Oct 5, 2004
Sold by
Goranov Krassimir Tzvetanov
Bought by
Chacon Milagro M
Home Financials for this Owner
Home Financials are based on the most recent Mortgage that was taken out on this home.
Original Mortgage
$154,500
Interest Rate
5.72%
Mortgage Type
New Conventional
Purchase Details
Closed on
Feb 27, 2003
Sold by
Chacon Kathleen M V and Ochoa Kathleen Mv
Bought by
Chacon Milagro M
Purchase Details
Closed on
Oct 17, 2001
Sold by
Chacon Ronnie Jose and Chacon Kathleen Monica
Bought by
Chacon Kathleen Monica
Purchase Details
Closed on
Jul 26, 1999
Sold by
Hud
Bought by
Chacon Ronnie Jose and Chacon Kathleen Monica
Home Financials for this Owner
Home Financials are based on the most recent Mortgage that was taken out on this home.
Original Mortgage
$81,329
Interest Rate
7.47%
Mortgage Type
FHA
Purchase Details
Closed on
Oct 14, 1998
Sold by
Norwest Mtg Inc
Bought by
Hud
Purchase Details
Closed on
Aug 26, 1998
Sold by
Haro Maria A
Bought by
Norwest Mtg Inc
Purchase Details
Closed on
Feb 6, 1996
Sold by
Jimenez Flaviano and Jimenez Hilda L
Bought by
Haro Maria Asencio
Home Financials for this Owner
Home Financials are based on the most recent Mortgage that was taken out on this home.
Original Mortgage
$83,987
Interest Rate
7.34%
Mortgage Type
FHA
Purchase Details
Closed on
Jan 17, 1995
Sold by
Hud
Bought by
Jimenez Flaviano and Jimenez Hilda L
Home Financials for this Owner
Home Financials are based on the most recent Mortgage that was taken out on this home.
Original Mortgage
$73,632
Interest Rate
9.21%
Mortgage Type
FHA
Purchase Details
Closed on
Oct 3, 1994
Sold by
Union Planters National Bank
Bought by
Hud
Purchase Details
Closed on
Jul 20, 1994
Sold by
Consolidated Reconveyance Company
Bought by
Union Planters Bank and Union Planters National Bank
Create a Home Valuation Report for This Property
The Home Valuation Report is an in-depth analysis detailing your home's value as well as a comparison with similar homes in the area
Home Values in the Area
Average Home Value in this Area
Purchase History
| Date | Buyer | Sale Price | Title Company |
|---|---|---|---|
| Chacon Milagro Minero | -- | Bnt Title Company Of Ca | |
| Goranov Milagro M | -- | First American Title Company | |
| Chacon Milagro M | -- | Itc Sb | |
| Chacon Milagro M | -- | -- | |
| Chacon Kathleen Monica | -- | -- | |
| Chacon Ronnie Jose | $82,500 | -- | |
| Hud | -- | First American Title Ins | |
| Norwest Mtg Inc | $90,758 | -- | |
| Haro Maria Asencio | $84,000 | Old Republic Title Company | |
| Jimenez Flaviano | $75,045 | Commonwealth Land Title | |
| Hud | -- | Stewart Title Co | |
| Union Planters Bank | $131,859 | Stewart Title Co |
Source: Public Records
Mortgage History
| Date | Status | Borrower | Loan Amount |
|---|---|---|---|
| Open | Chacon Milagro Minero | $109,000 | |
| Closed | Goranov Milagro M | $163,465 | |
| Closed | Chacon Milagro M | $154,500 | |
| Closed | Chacon Ronnie Jose | $81,329 | |
| Previous Owner | Haro Maria Asencio | $83,987 | |
| Previous Owner | Jimenez Flaviano | $73,632 |
Source: Public Records
Tax History
| Year | Tax Paid | Tax Assessment Tax Assessment Total Assessment is a certain percentage of the fair market value that is determined by local assessors to be the total taxable value of land and additions on the property. | Land | Improvement |
|---|---|---|---|---|
| 2025 | $2,815 | $246,185 | $57,918 | $188,267 |
| 2024 | $2,815 | $241,359 | $56,783 | $184,576 |
| 2023 | $2,815 | $236,627 | $55,670 | $180,957 |
| 2022 | $2,784 | $231,988 | $54,579 | $177,409 |
| 2021 | $2,731 | $227,440 | $53,509 | $173,931 |
| 2020 | $2,698 | $225,109 | $52,961 | $172,148 |
| 2019 | $2,636 | $220,696 | $51,923 | $168,773 |
| 2018 | $2,519 | $216,369 | $50,905 | $165,464 |
| 2017 | $2,485 | $212,127 | $49,907 | $162,220 |
| 2016 | $2,436 | $207,969 | $48,929 | $159,040 |
| 2015 | $2,389 | $204,847 | $48,195 | $156,652 |
| 2014 | $2,335 | $200,836 | $47,251 | $153,585 |
Source: Public Records
Map
Nearby Homes
- 1509 Portrait St
- 1491 Portrait St
- 1562 Remembrance Dr
- 316 Randy Ln
- 122 E Bowen Rd
- 1455 Remembrance Dr
- 338 Mildred St
- 344 Mildred St
- 1486 Olivecrest Way
- 21500 Orange Creek Rd
- 1462 Apple Creek Dr
- 1829 Springtree Dr
- 558 Cherry Vista Dr
- 1255 Comiskey Ct
- 1098 Richards Rd
- 129 Olivetree Dr
- 544 Turquoise Dr
- 1900 Summertree Dr
- 452 Feliz St
- 507 Coudures Way
- 1539 Ruby Dr
- 1545 Ruby Dr
- 1521 Ruby Dr
- 1540 Heirloom Ave
- 1546 Heirloom Ave
- 1551 Ruby Dr
- 1522 Heirloom Ave
- 1515 Ruby Dr
- 1552 Heirloom Ave
- 1557 Ruby Dr
- 1516 Heirloom Ave
- 1509 Ruby Dr
- 1558 Heirloom Ave
- 1510 Heirloom Ave
- 1563 Ruby Dr
- 1503 Ruby Dr
- 1564 Heirloom Ave
- 1535 Heirloom Ave
- 1541 Heirloom Ave
- 1529 Heirloom Ave
Your Personal Tour Guide
Ask me questions while you tour the home.