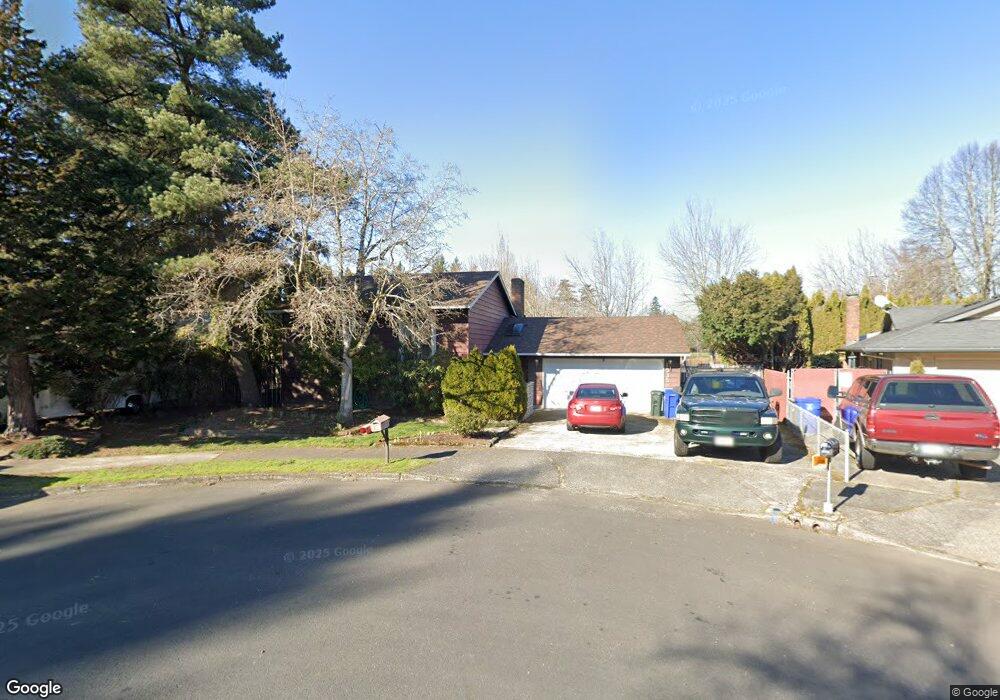
1535 NE 22 St-Priced To Sell Gresham, OR 97030
North Central NeighborhoodEstimated Value: $491,000 - $548,000
3
Beds
2
Baths
2,378
Sq Ft
$216/Sq Ft
Est. Value
About This Home
This home is located at 1535 NE 22 St-Priced To Sell, Gresham, OR 97030 and is currently estimated at $514,138, approximately $216 per square foot. 1535 NE 22 St-Priced To Sell is a home located in Multnomah County with nearby schools including Highland Elementary School, Clear Creek Middle School, and Gresham High School.
Ownership History
Date
Name
Owned For
Owner Type
Purchase Details
Closed on
Oct 12, 2007
Sold by
Parker Brent
Bought by
English Michael W and English Janet R
Current Estimated Value
Home Financials for this Owner
Home Financials are based on the most recent Mortgage that was taken out on this home.
Original Mortgage
$22,400
Outstanding Balance
$14,073
Interest Rate
6.42%
Mortgage Type
Credit Line Revolving
Estimated Equity
$500,065
Purchase Details
Closed on
Nov 30, 2001
Sold by
Keyser Robert C
Bought by
Parker Brent
Home Financials for this Owner
Home Financials are based on the most recent Mortgage that was taken out on this home.
Original Mortgage
$136,500
Interest Rate
7.25%
Mortgage Type
Purchase Money Mortgage
Purchase Details
Closed on
Aug 30, 1995
Sold by
Mick Richard J
Bought by
Keyser Robert C
Home Financials for this Owner
Home Financials are based on the most recent Mortgage that was taken out on this home.
Original Mortgage
$85,000
Interest Rate
7.63%
Mortgage Type
Purchase Money Mortgage
Create a Home Valuation Report for This Property
The Home Valuation Report is an in-depth analysis detailing your home's value as well as a comparison with similar homes in the area
Home Values in the Area
Average Home Value in this Area
Purchase History
| Date | Buyer | Sale Price | Title Company |
|---|---|---|---|
| English Michael W | $225,000 | First American Title Insuran | |
| Parker Brent | $182,000 | Chicago Title Insurance Co | |
| Keyser Robert C | $175,000 | First American Title Ins Co |
Source: Public Records
Mortgage History
| Date | Status | Borrower | Loan Amount |
|---|---|---|---|
| Open | English Michael W | $22,400 | |
| Previous Owner | Parker Brent | $136,500 | |
| Previous Owner | Keyser Robert C | $85,000 | |
| Closed | Parker Brent | $45,500 |
Source: Public Records
Tax History Compared to Growth
Tax History
| Year | Tax Paid | Tax Assessment Tax Assessment Total Assessment is a certain percentage of the fair market value that is determined by local assessors to be the total taxable value of land and additions on the property. | Land | Improvement |
|---|---|---|---|---|
| 2025 | $5,226 | $256,790 | -- | -- |
| 2024 | $5,002 | $249,320 | -- | -- |
| 2023 | $4,557 | $242,060 | $0 | $0 |
| 2022 | $4,430 | $235,010 | $0 | $0 |
| 2021 | $4,318 | $228,170 | $0 | $0 |
| 2020 | $4,063 | $221,530 | $0 | $0 |
| 2019 | $3,957 | $215,080 | $0 | $0 |
| 2018 | $3,773 | $208,820 | $0 | $0 |
| 2017 | $3,620 | $202,740 | $0 | $0 |
| 2016 | $3,192 | $196,840 | $0 | $0 |
| 2015 | $3,123 | $191,110 | $0 | $0 |
| 2014 | $3,047 | $185,550 | $0 | $0 |
Source: Public Records
Map
Nearby Homes
- 2280 NE Hogan Dr Unit 5
- 1094 NE 22nd St
- 2062 NE Hogan Dr Unit 26
- 2259 NE Morlan Ave
- 1920 NE View Ct
- 1556 NE 27th Terrace
- 1812 NE 19th St Unit 27
- 1802 NE Hogan Dr Unit 97
- 2105 NE Cleveland Ave
- 1722 NE Hogan Dr Unit 103
- 1700 NE Hogan Dr Unit 114
- 2475 NE Spruce Ave
- 2068 NE Juniper Ct
- 1418 NE Hogan Dr
- 535 NE 24th St
- 1816 NE Elliott Place
- 1308 NE Hogan Dr Unit 166
- 1302 NE Hogan Dr Unit 169
- 450 NE 22nd St
- 2593 NE Beech Ave
- 1535 NE 22nd St
- 1515 NE 22nd St
- 1585 NE 22nd St
- 2196 NE Vista Ave
- 1495 NE 22nd St
- 1430 NE 23rd St
- 2166 NE Vista Ave
- 1406 NE 23rd St
- 1455 NE 22nd St
- 1494 NE 22nd St
- 1406 NE 23 Streduced
- 2157 NE Vista Ave
- 2146 NE Vista Ave
- 2350 NE Maple Ct
- 1464 NE 22nd St
- 1425 NE 22nd St
- 1390 NE 23rd St
- 1523 NE 21st St
- 1483 NE 21st St
- 1424 NE 22nd St