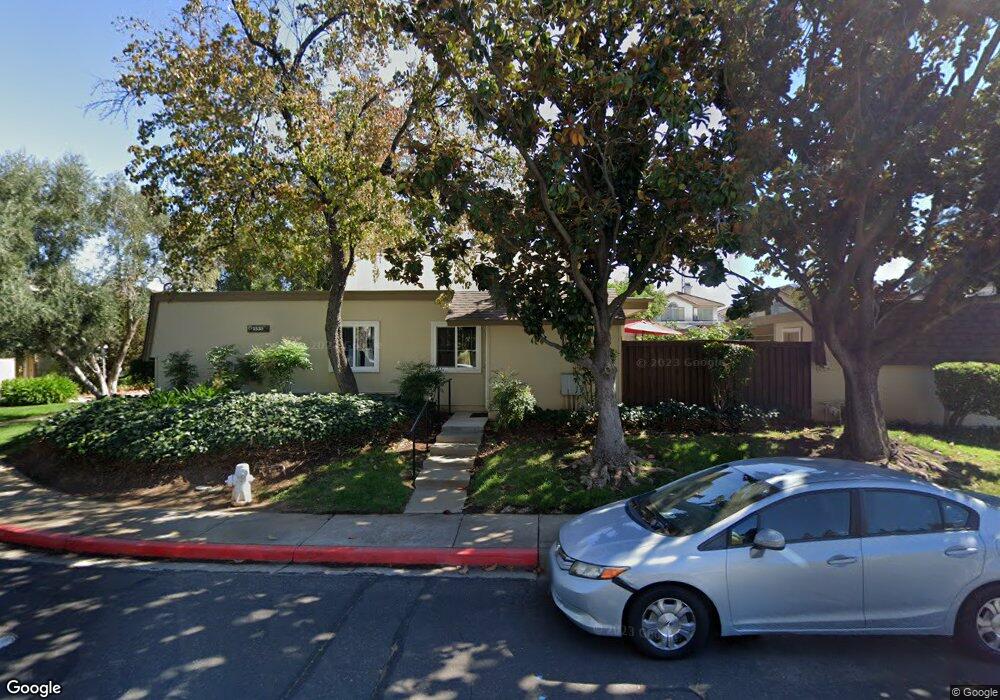
1535 Schenone Ct Unit B Concord, CA 94521
Rose Glen NeighborhoodEstimated Value: $402,000 - $471,000
2
Beds
2
Baths
1,093
Sq Ft
$392/Sq Ft
Est. Value
About This Home
This home is located at 1535 Schenone Ct Unit B, Concord, CA 94521 and is currently estimated at $428,046, approximately $391 per square foot. 1535 Schenone Ct Unit B is a home located in Contra Costa County with nearby schools including Ayers Elementary School, Pine Hollow Middle School, and College Park High School.
Ownership History
Date
Name
Owned For
Owner Type
Purchase Details
Closed on
Jun 18, 2013
Sold by
Sewali Henry
Bought by
Nuri Stoorai K
Current Estimated Value
Home Financials for this Owner
Home Financials are based on the most recent Mortgage that was taken out on this home.
Original Mortgage
$165,600
Outstanding Balance
$117,746
Interest Rate
3.48%
Mortgage Type
New Conventional
Estimated Equity
$310,300
Purchase Details
Closed on
Aug 22, 1996
Sold by
Salmon William L
Bought by
Sewali Henry
Home Financials for this Owner
Home Financials are based on the most recent Mortgage that was taken out on this home.
Original Mortgage
$91,411
Interest Rate
8.23%
Mortgage Type
Purchase Money Mortgage
Create a Home Valuation Report for This Property
The Home Valuation Report is an in-depth analysis detailing your home's value as well as a comparison with similar homes in the area
Home Values in the Area
Average Home Value in this Area
Purchase History
| Date | Buyer | Sale Price | Title Company |
|---|---|---|---|
| Nuri Stoorai K | $207,000 | Old Republic Title Company | |
| Sewali Henry | $91,500 | First American Title Co |
Source: Public Records
Mortgage History
| Date | Status | Borrower | Loan Amount |
|---|---|---|---|
| Open | Nuri Stoorai K | $165,600 | |
| Previous Owner | Sewali Henry | $91,411 |
Source: Public Records
Tax History
| Year | Tax Paid | Tax Assessment Tax Assessment Total Assessment is a certain percentage of the fair market value that is determined by local assessors to be the total taxable value of land and additions on the property. | Land | Improvement |
|---|---|---|---|---|
| 2025 | $3,811 | $254,894 | $123,138 | $131,756 |
| 2024 | $3,612 | $249,897 | $120,724 | $129,173 |
| 2023 | $3,612 | $244,998 | $118,357 | $126,641 |
| 2022 | $3,545 | $240,195 | $116,037 | $124,158 |
| 2021 | $3,444 | $235,486 | $113,762 | $121,724 |
| 2019 | $3,366 | $228,503 | $110,389 | $118,114 |
| 2018 | $3,229 | $224,024 | $108,225 | $115,799 |
| 2017 | $3,109 | $219,632 | $106,103 | $113,529 |
| 2016 | $3,001 | $215,326 | $104,023 | $111,303 |
| 2015 | $2,943 | $212,093 | $102,461 | $109,632 |
| 2014 | $2,869 | $207,939 | $100,454 | $107,485 |
Source: Public Records
Map
Nearby Homes
- 1520 Schenone Ct Unit 2
- 1531 Garcez Dr
- 5333 Park Highlands Blvd Unit 27
- 1505 Kirker Pass Rd Unit 170
- 1505 Kirker Pass Rd Unit 164
- 1505 Kirker Pass Rd Unit 119
- 5249 Olive Dr
- 1515 Ohara Ct
- 5505 Roundtree Dr Unit B
- 5248 Concord Blvd
- 1175 Kenwal Rd Unit B
- 5451 Roundtree Place Unit F
- 5150 Brookside Ln
- 5497 Roundtree Dr Unit D
- 1195 Kenwal Rd Unit C
- 1531 Eclipse Way
- 5442 Roundtree Ct Unit A
- 5492 Roundtree Dr Unit A
- 5468 Roundtree Dr Unit C
- 1560 Ayers Rd
- 1535 Schenone Ct Unit A
- 1535 Schenone Ct Unit C
- 1535 Schenone Ct Unit D
- 1535 Schenone Ct Unit F
- 1535 Schenone Ct Unit E
- 1535 Schenone Ct
- 1535 Schenone Ct
- 1535 Schenone Ct
- 1537 Lyric Ln
- 1541 Lyric Ln
- 1545 Lyric Ln
- 1551 Schenone Ct Unit A
- 1551 Schenone Ct Unit B
- 1551 Schenone Ct Unit C
- 1551 Schenone Ct Unit D
- 1551 Schenone Ct Unit E
- 1551 Schenone Ct Unit F
- 5329 Forte Ln
- 1531 Schenone Ct Unit B
- 1531 Schenone Ct
Your Personal Tour Guide
Ask me questions while you tour the home.