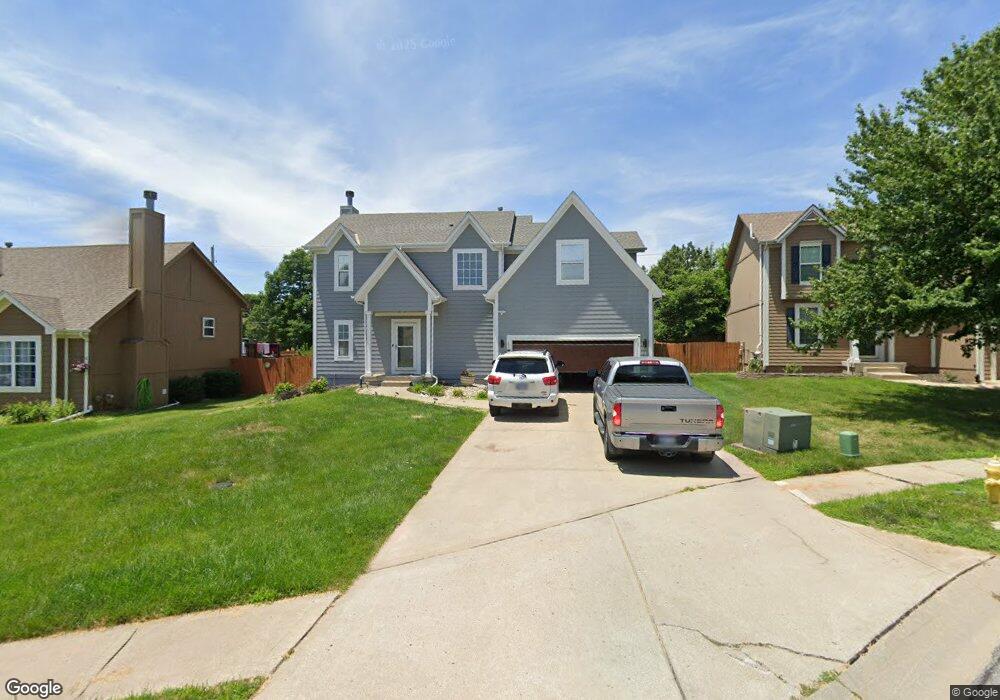
15350 S Constance St Olathe, KS 66062
Estimated Value: $409,768 - $440,000
4
Beds
3
Baths
1,809
Sq Ft
$232/Sq Ft
Est. Value
About This Home
This home is located at 15350 S Constance St, Olathe, KS 66062 and is currently estimated at $420,192, approximately $232 per square foot. 15350 S Constance St is a home located in Johnson County with nearby schools including Arbor Creek Elementary School, Chisholm Trail Middle School, and Olathe South Sr High School.
Ownership History
Date
Name
Owned For
Owner Type
Purchase Details
Closed on
Apr 1, 2009
Sold by
Baccam Santhiphone and Baccam Boua Ngeune V
Bought by
Baccam Santhiphone and Baccam Boua Ngeune
Current Estimated Value
Home Financials for this Owner
Home Financials are based on the most recent Mortgage that was taken out on this home.
Original Mortgage
$153,326
Outstanding Balance
$97,394
Interest Rate
5.03%
Mortgage Type
FHA
Estimated Equity
$322,798
Purchase Details
Closed on
Mar 1, 2008
Sold by
Baccam Sonny and Leuang Boua
Bought by
Baccam Santhiphone and Baccam Boua Ngeune
Purchase Details
Closed on
May 20, 2002
Sold by
Decker Bonnie Lois
Bought by
Baccam Sonny and Leuang Boua
Home Financials for this Owner
Home Financials are based on the most recent Mortgage that was taken out on this home.
Original Mortgage
$166,663
Interest Rate
6.92%
Mortgage Type
FHA
Purchase Details
Closed on
May 30, 2001
Sold by
Decker Bonnie and Spohn Candice
Bought by
Decker Bonnie Lois and Bonnie Lois Decker Trust
Create a Home Valuation Report for This Property
The Home Valuation Report is an in-depth analysis detailing your home's value as well as a comparison with similar homes in the area
Home Values in the Area
Average Home Value in this Area
Purchase History
| Date | Buyer | Sale Price | Title Company |
|---|---|---|---|
| Baccam Santhiphone | -- | Old Republic Title Company | |
| Baccam Santhiphone | -- | None Available | |
| Baccam Sonny | -- | Columbian National Title Ins | |
| Decker Bonnie Lois | -- | -- |
Source: Public Records
Mortgage History
| Date | Status | Borrower | Loan Amount |
|---|---|---|---|
| Open | Baccam Santhiphone | $153,326 | |
| Closed | Baccam Sonny | $166,663 |
Source: Public Records
Tax History Compared to Growth
Tax History
| Year | Tax Paid | Tax Assessment Tax Assessment Total Assessment is a certain percentage of the fair market value that is determined by local assessors to be the total taxable value of land and additions on the property. | Land | Improvement |
|---|---|---|---|---|
| 2024 | $4,540 | $40,468 | $8,282 | $32,186 |
| 2023 | $4,227 | $36,950 | $6,900 | $30,050 |
| 2022 | $3,799 | $32,338 | $6,003 | $26,335 |
| 2021 | $3,769 | $30,521 | $6,003 | $24,518 |
| 2020 | $3,654 | $29,325 | $6,003 | $23,322 |
| 2019 | $3,444 | $27,474 | $5,003 | $22,471 |
| 2018 | $3,346 | $26,508 | $5,003 | $21,505 |
| 2017 | $3,084 | $24,208 | $4,353 | $19,855 |
| 2016 | $2,786 | $22,448 | $4,353 | $18,095 |
| 2015 | $2,692 | $21,712 | $4,353 | $17,359 |
| 2013 | -- | $19,734 | $4,353 | $15,381 |
Source: Public Records
Map
Nearby Homes
- 14990 W 154th St
- 15168 W 154th St
- 15221 W 153rd St
- 15478 S Acuff Ln
- 0 133rd & S Blackfoot Dr Unit HMS2572444
- 15403 W 155th Terrace
- 15343 S Navaho Dr
- 14296 W 153rd St
- 15643 W 149th Terrace
- 15375 W 147th Terrace
- 15577 S Arapaho St
- 14031 W 152nd Terrace Unit 3703
- 15241 S Symphony Dr Unit 3402
- 14165 W 149th Terrace
- 15129 S Locust St
- 15525 S Summertree Ln
- 15455 W 159th St
- 14820 S Brougham Dr
- 14650 S Alden St
- 15101 W 146th Cir
- 15354 S Constance St
- 15346 S Constance St
- 15358 S Constance St
- 15342 S Constance St
- 15362 S Constance St
- 15361 S Constance St
- 15357 S Constance St
- 15365 S Constance St
- 15341 S Constance St
- 15110 W 153rd Terrace
- 15345 S Constance St
- 15370 S Constance St
- 15369 S Constance St
- 15375 S Constance St
- 15115 W 153rd St
- 15125 W 153rd St
- 15374 S Constance St
- 15360 S Darnell St
- 15364 S Darnell St
- 15116 W 153rd Terrace