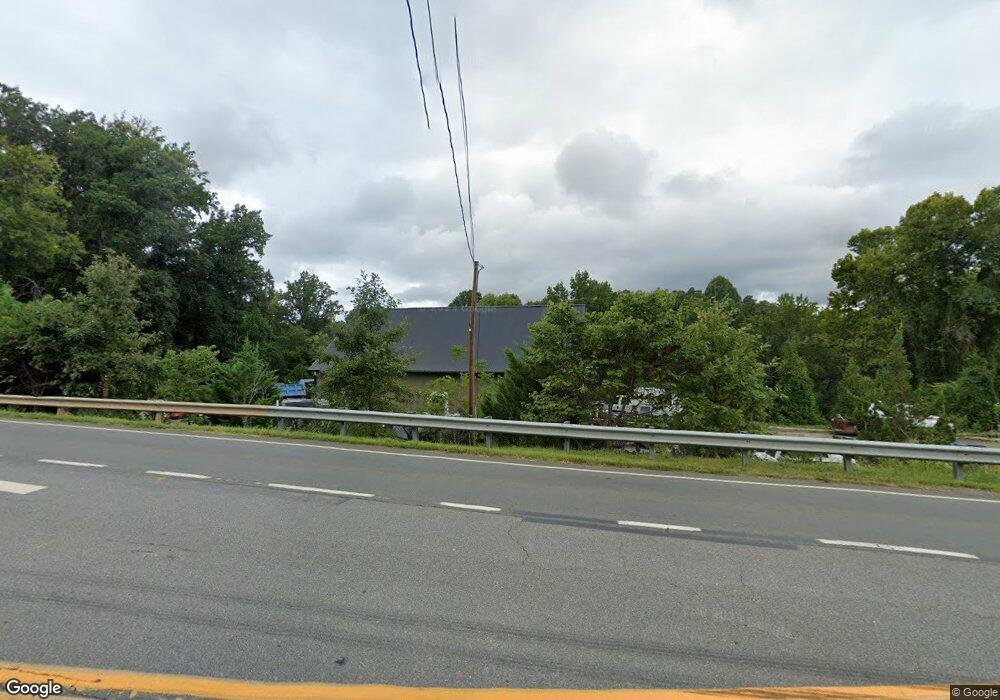
1536 Avon Street Extension Charlottesville, VA 22902
Southeast Charlottesville NeighborhoodEstimated Value: $573,000
--
Bed
--
Bath
2,240
Sq Ft
$256/Sq Ft
Est. Value
About This Home
This home is located at 1536 Avon Street Extension, Charlottesville, VA 22902 and is currently estimated at $573,000, approximately $255 per square foot. 1536 Avon Street Extension is a home located in Albemarle County with nearby schools including Mountain View Elementary School, Walton Middle School, and Monticello High School.
Ownership History
Date
Name
Owned For
Owner Type
Purchase Details
Closed on
Jun 25, 2014
Sold by
Wheeler John Daniel and Wheeler Donald Lee
Bought by
Virginia Asphalt Services Inc
Current Estimated Value
Home Financials for this Owner
Home Financials are based on the most recent Mortgage that was taken out on this home.
Original Mortgage
$182,000
Outstanding Balance
$138,422
Interest Rate
4.12%
Mortgage Type
Commercial
Estimated Equity
$434,578
Create a Home Valuation Report for This Property
The Home Valuation Report is an in-depth analysis detailing your home's value as well as a comparison with similar homes in the area
Home Values in the Area
Average Home Value in this Area
Purchase History
| Date | Buyer | Sale Price | Title Company |
|---|---|---|---|
| Virginia Asphalt Services Inc | $221,200 | Old Republic National Title |
Source: Public Records
Mortgage History
| Date | Status | Borrower | Loan Amount |
|---|---|---|---|
| Open | Virginia Asphalt Services Inc | $182,000 |
Source: Public Records
Tax History Compared to Growth
Tax History
| Year | Tax Paid | Tax Assessment Tax Assessment Total Assessment is a certain percentage of the fair market value that is determined by local assessors to be the total taxable value of land and additions on the property. | Land | Improvement |
|---|---|---|---|---|
| 2025 | $4,788 | $535,600 | $309,600 | $226,000 |
| 2024 | $4,620 | $541,000 | $309,600 | $231,400 |
| 2023 | $4,478 | $524,300 | $309,600 | $214,700 |
| 2022 | $3,606 | $422,200 | $216,700 | $205,500 |
| 2021 | $3,580 | $419,193 | $216,700 | $202,493 |
| 2020 | $3,565 | $417,400 | $216,700 | $200,700 |
| 2019 | $3,464 | $405,600 | $216,700 | $188,900 |
| 2018 | $3,325 | $396,300 | $216,700 | $179,600 |
| 2017 | $3,325 | $396,300 | $216,700 | $179,600 |
| 2016 | $1,856 | $221,200 | $216,700 | $4,500 |
| 2015 | $1,812 | $221,200 | $216,700 | $4,500 |
| 2014 | -- | $221,200 | $216,700 | $4,500 |
Source: Public Records
Map
Nearby Homes