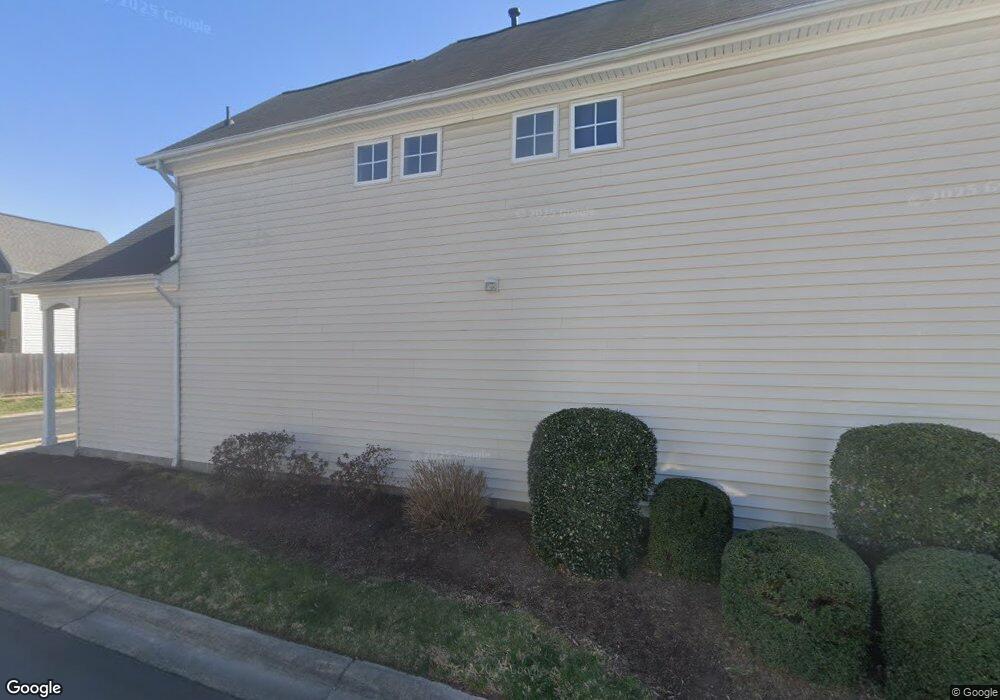
1537 Wynd Crest Way Virginia Beach, VA 23456
Salem NeighborhoodEstimated Value: $351,457 - $363,000
3
Beds
3
Baths
1,740
Sq Ft
$207/Sq Ft
Est. Value
About This Home
This home is located at 1537 Wynd Crest Way, Virginia Beach, VA 23456 and is currently estimated at $359,364, approximately $206 per square foot. 1537 Wynd Crest Way is a home located in Virginia Beach City with nearby schools including Rosemont Forest Elementary School, Salem Middle School, and Salem High School.
Ownership History
Date
Name
Owned For
Owner Type
Purchase Details
Closed on
Sep 11, 2013
Sold by
Hutchins Jared C
Bought by
Hood Brandon A
Current Estimated Value
Home Financials for this Owner
Home Financials are based on the most recent Mortgage that was taken out on this home.
Original Mortgage
$224,730
Outstanding Balance
$167,900
Interest Rate
4.43%
Mortgage Type
VA
Estimated Equity
$191,464
Purchase Details
Closed on
Jul 29, 2005
Sold by
Dodson Kisha D
Bought by
Hutchins Jared C
Home Financials for this Owner
Home Financials are based on the most recent Mortgage that was taken out on this home.
Original Mortgage
$230,000
Interest Rate
5.63%
Mortgage Type
New Conventional
Purchase Details
Closed on
Jul 17, 2001
Sold by
The Terry Companies Four
Bought by
Dodson Kisha D
Home Financials for this Owner
Home Financials are based on the most recent Mortgage that was taken out on this home.
Original Mortgage
$154,700
Interest Rate
7.2%
Create a Home Valuation Report for This Property
The Home Valuation Report is an in-depth analysis detailing your home's value as well as a comparison with similar homes in the area
Home Values in the Area
Average Home Value in this Area
Purchase History
| Date | Buyer | Sale Price | Title Company |
|---|---|---|---|
| Hood Brandon A | $220,000 | -- | |
| Hutchins Jared C | $287,500 | -- | |
| Dodson Kisha D | $159,485 | -- |
Source: Public Records
Mortgage History
| Date | Status | Borrower | Loan Amount |
|---|---|---|---|
| Open | Hood Brandon A | $224,730 | |
| Previous Owner | Hutchins Jared C | $230,000 | |
| Previous Owner | Dodson Kisha D | $154,700 |
Source: Public Records
Tax History Compared to Growth
Tax History
| Year | Tax Paid | Tax Assessment Tax Assessment Total Assessment is a certain percentage of the fair market value that is determined by local assessors to be the total taxable value of land and additions on the property. | Land | Improvement |
|---|---|---|---|---|
| 2025 | $2,765 | $294,100 | $110,000 | $184,100 |
| 2024 | $2,765 | $285,100 | $110,000 | $175,100 |
| 2023 | $2,733 | $276,100 | $101,000 | $175,100 |
| 2022 | $2,490 | $251,500 | $78,000 | $173,500 |
| 2021 | $2,386 | $241,000 | $74,000 | $167,000 |
| 2020 | $2,307 | $226,700 | $74,000 | $152,700 |
| 2019 | $2,245 | $216,600 | $70,000 | $146,600 |
| 2018 | $2,171 | $216,600 | $70,000 | $146,600 |
| 2017 | $2,120 | $211,500 | $68,000 | $143,500 |
| 2016 | $2,058 | $207,900 | $66,000 | $141,900 |
| 2015 | $2,110 | $213,100 | $68,000 | $145,100 |
| 2014 | $1,962 | $209,600 | $76,300 | $133,300 |
Source: Public Records
Map
Nearby Homes
- 1573 Wynd Crest Way
- 1412 Athol Ct
- 4357 Elderberry Ln
- 4224 Turnworth Arch
- 4305 Salem Springs Way
- 4276 Derby Wharf Dr
- 1605 Brimington Ln
- 1824 Perla Dr
- 1900 Haywards Heath
- 1900 Grey Friars Chase
- 4225 Kenton Ln
- 1425 Round Hill Dr
- 1652 Castlefield Rd
- 1637 Castlefield Rd
- 1537 Penrose Arch
- 1309 Woodbridge Trail
- 4700 Berrywood Ct
- 4729 Berrywood Rd
- The Addison Plan at Guilford at Spence Crossing
- The Rowen Plan at Guilford at Spence Crossing
- 1541 Wynd Crest Way
- 1545 Wynd Crest Way
- 1549 Wynd Crest Way
- 1553 Wynd Crest Way
- 1536 Wynd Crest Way
- 1696 Wynd Crest Way
- 1508 Chateau Run Ct
- 4309 Calistoga Ct
- 1692 Wynd Crest Way
- 1689 Wynd Crest Way
- 1548 Wynd Crest Way
- 1685 Wynd Crest Way
- 4308 Napa Ct
- 1528 Wynd Crest Way
- 1509 Chateau Run Ct
- 1557 Wynd Crest Way
- 1504 Chateau Run Ct
- 1504 Chateau Run
- 4308 Calistoga Ct
- 1500 Chateau Run Ct