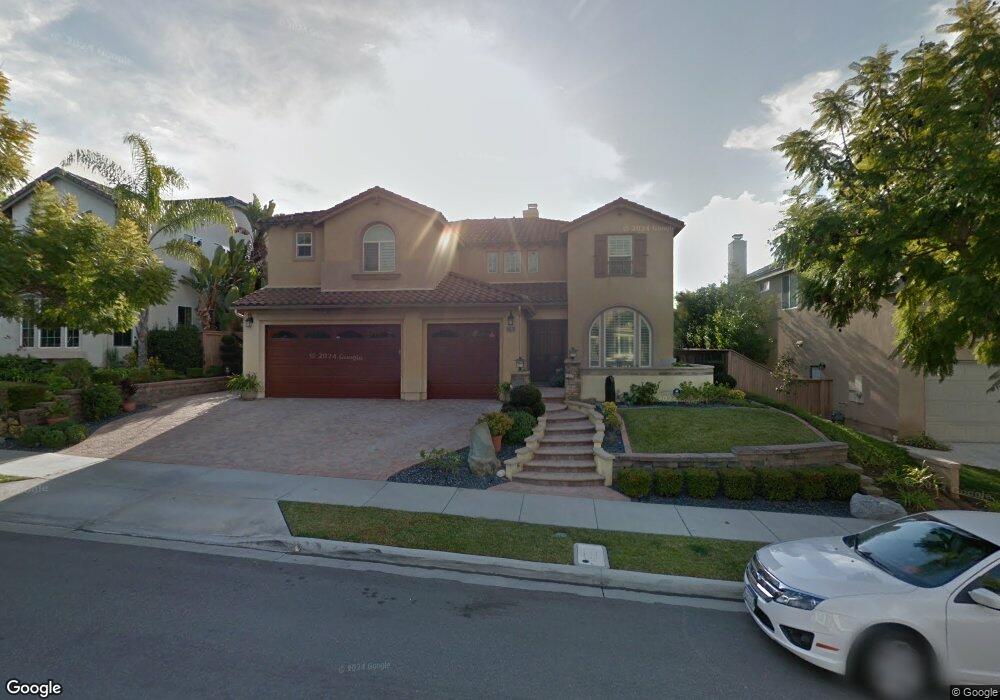
15375 Cayenne Creek Ct San Diego, CA 92127
4S Ranch NeighborhoodEstimated Value: $2,298,084 - $2,548,000
5
Beds
5
Baths
3,756
Sq Ft
$657/Sq Ft
Est. Value
About This Home
This home is located at 15375 Cayenne Creek Ct, San Diego, CA 92127 and is currently estimated at $2,468,271, approximately $657 per square foot. 15375 Cayenne Creek Ct is a home located in San Diego County with nearby schools including Stone Ranch Elementary, Oak Valley Middle, and Del Norte High School.
Ownership History
Date
Name
Owned For
Owner Type
Purchase Details
Closed on
Jul 11, 2022
Sold by
Dejesus Antonio S and Dejesus Josephine D
Bought by
Dejesus Rrevocable Trust
Current Estimated Value
Purchase Details
Closed on
Aug 27, 2003
Sold by
Pulte Home Corp
Bought by
Dejesus Antonio S and Dejesus Josephine D
Home Financials for this Owner
Home Financials are based on the most recent Mortgage that was taken out on this home.
Original Mortgage
$522,400
Interest Rate
3.75%
Mortgage Type
Unknown
Create a Home Valuation Report for This Property
The Home Valuation Report is an in-depth analysis detailing your home's value as well as a comparison with similar homes in the area
Home Values in the Area
Average Home Value in this Area
Purchase History
| Date | Buyer | Sale Price | Title Company |
|---|---|---|---|
| Dejesus Rrevocable Trust | -- | None Listed On Document | |
| Dejesus Antonio S | -- | None Listed On Document | |
| Dejesus Antonio S | $654,500 | Chicago Title Co |
Source: Public Records
Mortgage History
| Date | Status | Borrower | Loan Amount |
|---|---|---|---|
| Previous Owner | Dejesus Antonio S | $522,400 |
Source: Public Records
Tax History Compared to Growth
Tax History
| Year | Tax Paid | Tax Assessment Tax Assessment Total Assessment is a certain percentage of the fair market value that is determined by local assessors to be the total taxable value of land and additions on the property. | Land | Improvement |
|---|---|---|---|---|
| 2025 | $16,156 | $930,125 | $257,623 | $672,502 |
| 2024 | $16,156 | $911,888 | $252,572 | $659,316 |
| 2023 | $15,850 | $894,009 | $247,620 | $646,389 |
| 2022 | $15,646 | $876,480 | $242,765 | $633,715 |
| 2021 | $19,509 | $859,295 | $238,005 | $621,290 |
| 2020 | $19,256 | $850,485 | $235,565 | $614,920 |
| 2019 | $18,950 | $833,810 | $230,947 | $602,863 |
| 2018 | $19,882 | $817,462 | $226,419 | $591,043 |
| 2017 | $19,243 | $801,434 | $221,980 | $579,454 |
| 2016 | $19,009 | $785,721 | $217,628 | $568,093 |
| 2015 | $19,041 | $773,920 | $214,360 | $559,560 |
| 2014 | $14,542 | $758,760 | $210,161 | $548,599 |
Source: Public Records
Map
Nearby Homes
- 15240 Cayenne Creek Ct
- 16115 Palomino Valley Ct
- 10659 Paseo Allegria Ave
- 15985 Camino Crisalida Unit 5
- 16488 Fox Valley Dr
- 10832 Avenida de Los Lobos
- 9955 Fieldthorn St Unit T78
- 15273 Maturin Dr Unit 40
- 16174 Deer Ridge Ct
- 15283 Maturin Dr Unit 62
- 15267 Maturin Dr Unit 17
- 10482 Hollingsworth Way Unit 187
- 11251 Avenida de Los Lobos Unit D
- 9632 Deer Trail Dr
- 15373 Maturin Dr Unit 178
- 10551 Sanshey Ln Unit 132
- 16222 Veridian Cir
- 16206 Veridian Cir
- 17019 Camino Marcilla Unit 5
- 17059 Calle Trevino Unit 5
- 15361 Cayenne Creek Ct
- 15389 Cayenne Creek Ct
- 15347 Cayenne Creek Ct
- 16169 Falcon Crest Dr
- 15376 Cayenne Creek Ct
- 16206 Cayenne Ridge Rd
- 16214 Cayenne Ridge Rd
- 15333 Cayenne Creek Ct
- 15362 Cayenne Creek Ct
- 16222 Cayenne Ridge Rd
- 16182 Cayenne Ridge Rd
- 16161 Falcon Crest Dr
- 16230 Cayenne Ridge Rd
- 15334 Cayenne Creek Ct
- 16238 Cayenne Ridge Rd
- 15319 Cayenne Creek Ct
- 16170 Falcon Crest Dr
- 16246 Cayenne Ridge Rd
- 16254 Cayenne Ridge Rd
- 16174 Cayenne Ridge Rd