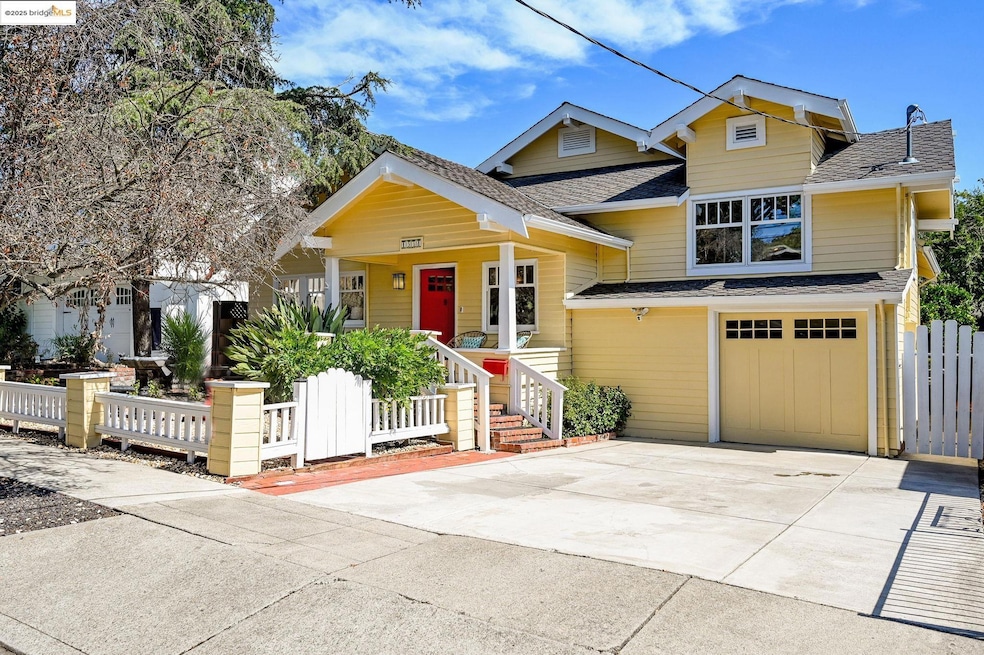
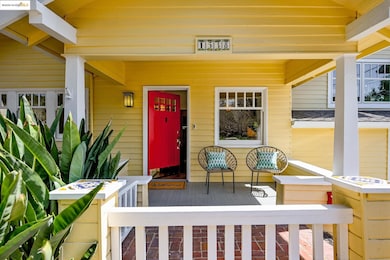
1538 Brooks St Walnut Creek, CA 94596
Downtown Walnut Creek NeighborhoodEstimated payment $7,246/month
Highlights
- Updated Kitchen
- Wood Flooring
- Double Oven
- Buena Vista Elementary School Rated A
- No HOA
- 1 Car Attached Garage
About This Home
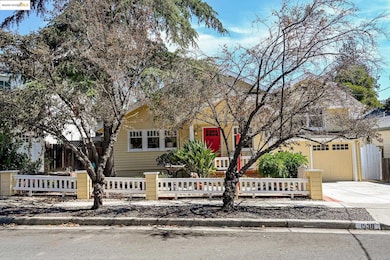
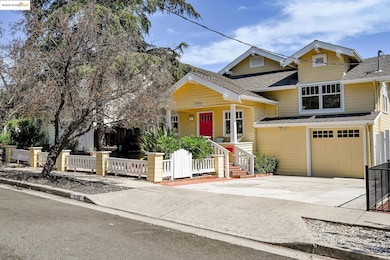
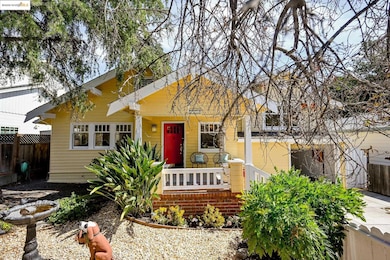
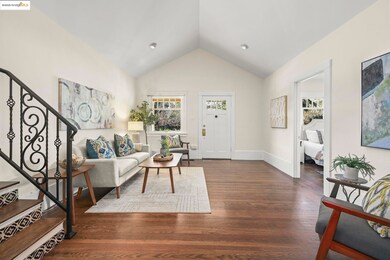
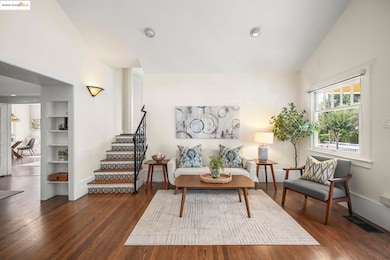
A Rare find – A Must See! Don't miss this rare and exceptional opportunity! Located in the highly sought after Almond-Shuey area, Walnut Creek's only true downtown neighborhood! A short stroll to downtown shopping, restaurants, nightlife, Bart, Sunday's farmer's market and easy access to 680 and 24. This 1920era bungalow has been expanded, updated and meticously maintained without losing it's original warmth and charm. Featuring 3 bdrms, 2 1⁄2 bths, formal dining room, living room and family room with hardwood floors, gas fireplace, tile baths and craftsman style light fixtures this house standsout in a neighborhood where sales are rare! The kitchen with an antique 6 burner gas stove complements the granite tile counters and stainless appliances. Low maintenance yards feature a centrally located fountain on a brick patio framed by gorgeous rose bushes and margarita trees (orange and lime trees). Central heat, AC, copper piping,tankless water heater with recirculation pump makes for easy living in Walnut Creek's original neighborhood. This unique family home has been owned by only 2 families in almost a century and not on market since 1989.
Home Details
Home Type
- Single Family
Est. Annual Taxes
- $3,560
Year Built
- Built in 1920
Lot Details
- 5,950 Sq Ft Lot
- Back and Front Yard
Parking
- 1 Car Attached Garage
- Front Facing Garage
- Garage Door Opener
Home Design
- Bungalow
- Frame Construction
- Composition Shingle Roof
- Wood Shingle Exterior
- Composition Shingle
Interior Spaces
- 1-Story Property
- Gas Fireplace
- Double Pane Windows
- Family Room with Fireplace
Kitchen
- Updated Kitchen
- Double Oven
- Microwave
- Dishwasher
Flooring
- Wood
- Tile
Bedrooms and Bathrooms
- 2 Bedrooms
Laundry
- Laundry closet
- Stacked Washer and Dryer
- 220 Volts In Laundry
Utilities
- Forced Air Heating and Cooling System
- Tankless Water Heater
- Gas Water Heater
Community Details
- No Home Owners Association
- Almond Court Subdivision
Listing and Financial Details
- Assessor Parcel Number 1781200165
Map
Home Values in the Area
Average Home Value in this Area
Tax History
| Year | Tax Paid | Tax Assessment Tax Assessment Total Assessment is a certain percentage of the fair market value that is determined by local assessors to be the total taxable value of land and additions on the property. | Land | Improvement |
|---|---|---|---|---|
| 2025 | $3,560 | $394,009 | $200,776 | $193,233 |
| 2024 | $3,534 | $386,285 | $196,840 | $189,445 |
| 2023 | $3,534 | $378,712 | $192,981 | $185,731 |
| 2022 | $3,558 | $371,288 | $189,198 | $182,090 |
| 2021 | $3,457 | $364,009 | $185,489 | $178,520 |
| 2019 | $3,398 | $353,215 | $179,989 | $173,226 |
| 2018 | $3,308 | $346,290 | $176,460 | $169,830 |
| 2017 | $4,668 | $339,500 | $173,000 | $166,500 |
| 2016 | $4,569 | $332,844 | $169,608 | $163,236 |
| 2015 | $4,459 | $327,846 | $167,061 | $160,785 |
| 2014 | $4,395 | $321,425 | $163,789 | $157,636 |
Property History
| Date | Event | Price | List to Sale | Price per Sq Ft |
|---|---|---|---|---|
| 10/30/2025 10/30/25 | Price Changed | $1,325,000 | -1.6% | $832 / Sq Ft |
| 10/15/2025 10/15/25 | Price Changed | $1,347,000 | -3.6% | $846 / Sq Ft |
| 09/18/2025 09/18/25 | For Sale | $1,397,000 | -- | $878 / Sq Ft |
Purchase History
| Date | Type | Sale Price | Title Company |
|---|---|---|---|
| Interfamily Deed Transfer | -- | None Available | |
| Interfamily Deed Transfer | -- | Placer Title Company | |
| Interfamily Deed Transfer | -- | Fidelity National Title | |
| Interfamily Deed Transfer | -- | First American Title |
Mortgage History
| Date | Status | Loan Amount | Loan Type |
|---|---|---|---|
| Closed | $938,250 | Reverse Mortgage Home Equity Conversion Mortgage | |
| Closed | $25,000 | Purchase Money Mortgage |
Source: bridgeMLS
MLS Number: 41112019
APN: 178-120-016-5
Disclaimer: Certain information contained herein is derived from information provided by parties other than Homes.com. All information provided is deemed reliable, but is not guaranteed to be accurate and should be independently verified.
![]() Bay East 2025. CCAR 2025. bridgeMLS 2025. Information Deemed Reliable But Not Guaranteed. This information is being provided by the Bay East MLS, or CCAR MLS, or bridgeMLS. The listings presented here may or may not be listed by the Broker/Agent operating this website. This information is intended for the personal use of consumers and may not be used for any purpose other than to identify prospective properties consumers may be interested in purchasing.
Bay East 2025. CCAR 2025. bridgeMLS 2025. Information Deemed Reliable But Not Guaranteed. This information is being provided by the Bay East MLS, or CCAR MLS, or bridgeMLS. The listings presented here may or may not be listed by the Broker/Agent operating this website. This information is intended for the personal use of consumers and may not be used for any purpose other than to identify prospective properties consumers may be interested in purchasing.
- 1655 N California Blvd Unit 338
- 1655 N California Blvd Unit 114
- 1655 N California Blvd Unit 422
- 1655 N California Blvd Unit 214
- 1756 Cole Ave Unit 103
- 122 Vista Hermosa
- 1282 Carmel Ct
- 555 Ygnacio Valley Rd Unit 309
- 555 Ygnacio Valley Rd Unit 204
- 1743 Carmel Dr Unit 9
- 74-78 Palana Ct
- 1340 Mount Pisgah Rd
- 1760 Magnolia Way
- 1696 San Miguel Dr Unit F9
- 1640 San Miguel Dr
- 1806 Newell Ave
- 28 Holcomb Ct
- 155 Sharene Ln Unit 111
- 105 Hillcroft Way
- 243 Haleena Place
- 1755 Trinity Ave
- 1812 Trinity Ave
- 1500 N California Blvd
- 1380 N California Blvd
- 1672 Terrace Rd
- 1800 Lacassie Ave Unit FL2-ID1893
- 1800 Lacassie Ave Unit FL3-ID984
- 1800 Lacassie Ave
- 1716 N Main St
- 1310-1330 Alma Ave
- 1776 Bothelo Dr
- 1960 N Main St
- 101 Pringle Ave
- 1600 Carmel Dr
- 1600 Carmel Dr Unit 15
- 1355 Mount Pisgah Rd
- 1756 Carmel Dr
- 1160 Lincoln Ave
- 1100 Lincoln Ave
- 1250 Walker Ave
