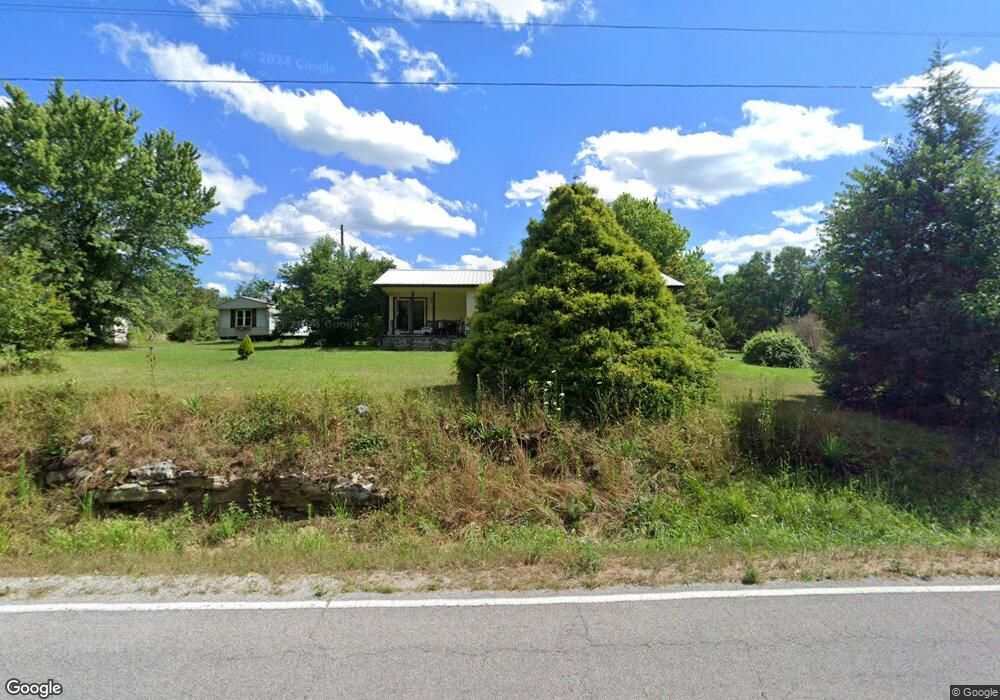
1539 Genesis Rd Lancing, TN 37770
Estimated Value: $81,000 - $174,000
--
Bed
1
Bath
1,040
Sq Ft
$127/Sq Ft
Est. Value
About This Home
This home is located at 1539 Genesis Rd, Lancing, TN 37770 and is currently estimated at $132,380, approximately $127 per square foot. 1539 Genesis Rd is a home located in Morgan County with nearby schools including Central Elementary School, Petros Joyner Elementary School, and Central Middle School.
Ownership History
Date
Name
Owned For
Owner Type
Purchase Details
Closed on
May 16, 2025
Sold by
Potter Solomon Amos and Potter Christina Nicole
Bought by
Potter Solomon Amos and Potter Christina Nicole
Current Estimated Value
Purchase Details
Closed on
Jun 24, 2024
Sold by
Melton Russell L
Bought by
Potter Solomon Amos
Home Financials for this Owner
Home Financials are based on the most recent Mortgage that was taken out on this home.
Original Mortgage
$200,032
Interest Rate
7.02%
Mortgage Type
FHA
Purchase Details
Closed on
Sep 1, 2021
Sold by
Melton Russell L
Bought by
Juarez Richard
Purchase Details
Closed on
Dec 3, 2015
Sold by
Melton Russell L
Bought by
Ross Angela
Purchase Details
Closed on
Mar 28, 2012
Sold by
Melton Russell
Bought by
Potter Chester Don and Potter Cathy Marie
Purchase Details
Closed on
Feb 16, 1994
Bought by
Melton Russell L
Purchase Details
Closed on
Jan 31, 1975
Bought by
Aytes William David and Rose Ann
Create a Home Valuation Report for This Property
The Home Valuation Report is an in-depth analysis detailing your home's value as well as a comparison with similar homes in the area
Home Values in the Area
Average Home Value in this Area
Purchase History
| Date | Buyer | Sale Price | Title Company |
|---|---|---|---|
| Potter Solomon Amos | -- | Magnolia Title | |
| Potter Solomon Amos | -- | Magnolia Title | |
| Potter Solomon Amos | $10,000 | Magnolia Title | |
| Juarez Richard | $16,000 | Radiant Title Llc | |
| Ross Angela | $38,000 | -- | |
| Potter Chester Don | -- | -- | |
| Melton Russell L | $40,000 | -- | |
| Aytes William David | -- | -- |
Source: Public Records
Mortgage History
| Date | Status | Borrower | Loan Amount |
|---|---|---|---|
| Previous Owner | Potter Solomon Amos | $200,032 |
Source: Public Records
Tax History Compared to Growth
Tax History
| Year | Tax Paid | Tax Assessment Tax Assessment Total Assessment is a certain percentage of the fair market value that is determined by local assessors to be the total taxable value of land and additions on the property. | Land | Improvement |
|---|---|---|---|---|
| 2025 | $592 | $21,925 | $0 | $0 |
| 2024 | $592 | $21,775 | $3,950 | $17,825 |
| 2023 | $592 | $21,775 | $3,950 | $17,825 |
| 2022 | $585 | $21,525 | $3,950 | $17,575 |
| 2021 | $629 | $21,525 | $3,950 | $17,575 |
| 2020 | $583 | $23,125 | $5,550 | $17,575 |
| 2019 | $583 | $17,825 | $4,475 | $13,350 |
| 2018 | $583 | $17,825 | $4,475 | $13,350 |
| 2017 | $141 | $4,475 | $4,475 | $0 |
| 2016 | $141 | $4,475 | $4,475 | $0 |
| 2015 | $139 | $4,475 | $4,475 | $0 |
| 2014 | $559 | $18,025 | $6,100 | $11,925 |
| 2013 | $558 | $18,007 | $0 | $0 |
Source: Public Records
Map
Nearby Homes
- 1725 Genesis Rd
- 182 Huse Potter Rd
- 952 Genesis Rd
- 243 A Mountain View Dr
- 0 8 52 Acres - 216 Valerie Dr
- 910 Barnett Bridge Rd
- 0 Muddy Branch Rd Unit 1305276
- 0 Muddy Branch Rd Unit 236192
- 0 Hemlock Bluff Way Unit RTC2925995
- 0 Hemlock Bluff Way Unit 1515803
- 444 Island Ford Rd
- 0 6 25 Acres Valerie Dr
- 0 10 77 Acres - Valerie Dr
- 6.94ac White Creek
- 10.77 Ac Valerie Dr
- 10.76 Acres Valerie Dr
- 6.25 Acres Valerie Dr
- 6.25 Acr Valerie Dr
- 4.14 Acres Nashville Hwy
- 414 Nashville Hwy
- 1541 Genesis Rd
- 00 Genesis Rd
- 0 Genesis Rd
- 122 Frankfort Rd
- 1550 Genesis Rd
- 1559 Genesis Rd
- 1521 Genesis Rd
- 1575 Genesis Rd
- 180 Frankfort Rd
- 165 Frankfort Rd
- 1583 Genesis Rd
- 155 Frankfort Rd
- 308 Frankfort Rd
- 1482 Genesis Rd
- 189 Frankfort Rd
- 167 Big Johns Rd
- 305 Frankfort Rd
- 1464 Genesis Rd
- 1461 Genesis Rd
- 115 Gibson Rd