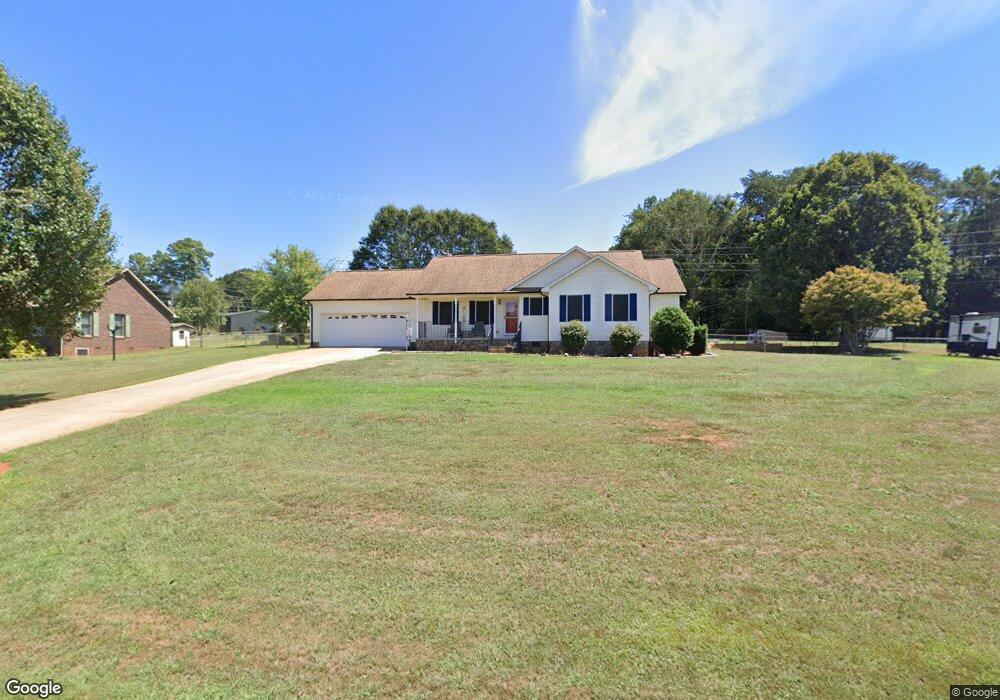
1539 Jessica Ann Rd Lincolnton, NC 28092
Estimated Value: $302,620 - $350,000
3
Beds
2
Baths
1,365
Sq Ft
$234/Sq Ft
Est. Value
About This Home
This home is located at 1539 Jessica Ann Rd, Lincolnton, NC 28092 and is currently estimated at $319,905, approximately $234 per square foot. 1539 Jessica Ann Rd is a home located in Lincoln County with nearby schools including S. Ray Lowder Elementary School, Lincolnton Middle School, and Lincolnton High School.
Ownership History
Date
Name
Owned For
Owner Type
Purchase Details
Closed on
Apr 25, 2016
Sold by
Teague Curt
Bought by
Davis Michael and Davis Katherine
Current Estimated Value
Home Financials for this Owner
Home Financials are based on the most recent Mortgage that was taken out on this home.
Original Mortgage
$144,400
Outstanding Balance
$115,139
Interest Rate
3.71%
Mortgage Type
New Conventional
Estimated Equity
$204,766
Purchase Details
Closed on
Jul 3, 2008
Sold by
Stinnette Janna
Bought by
Teague Curt
Purchase Details
Closed on
Aug 16, 2007
Sold by
Jones Charles H and Jones Patricia A
Bought by
Teague Curt R
Home Financials for this Owner
Home Financials are based on the most recent Mortgage that was taken out on this home.
Original Mortgage
$124,400
Interest Rate
6.56%
Mortgage Type
New Conventional
Purchase Details
Closed on
Dec 1, 1995
Bought by
Jones Charles J and Jones Patricia A
Create a Home Valuation Report for This Property
The Home Valuation Report is an in-depth analysis detailing your home's value as well as a comparison with similar homes in the area
Home Values in the Area
Average Home Value in this Area
Purchase History
| Date | Buyer | Sale Price | Title Company |
|---|---|---|---|
| Davis Michael | $152,500 | None Available | |
| Teague Curt | -- | None Available | |
| Teague Curt R | $155,500 | None Available | |
| Jones Charles J | $95,500 | -- |
Source: Public Records
Mortgage History
| Date | Status | Borrower | Loan Amount |
|---|---|---|---|
| Open | Davis Michael | $144,400 | |
| Previous Owner | Teague Curt R | $124,400 |
Source: Public Records
Tax History Compared to Growth
Tax History
| Year | Tax Paid | Tax Assessment Tax Assessment Total Assessment is a certain percentage of the fair market value that is determined by local assessors to be the total taxable value of land and additions on the property. | Land | Improvement |
|---|---|---|---|---|
| 2025 | $1,870 | $277,175 | $28,000 | $249,175 |
| 2024 | $1,850 | $277,175 | $28,000 | $249,175 |
| 2023 | $1,845 | $277,175 | $28,000 | $249,175 |
| 2022 | $1,372 | $168,974 | $22,000 | $146,974 |
| 2021 | $1,372 | $168,974 | $22,000 | $146,974 |
| 2020 | $1,223 | $168,974 | $22,000 | $146,974 |
| 2019 | $1,190 | $168,974 | $22,000 | $146,974 |
| 2018 | $1,109 | $140,741 | $19,500 | $121,241 |
| 2017 | $1,001 | $140,741 | $19,500 | $121,241 |
| 2016 | $1,001 | $140,741 | $19,500 | $121,241 |
| 2015 | $1,067 | $140,741 | $19,500 | $121,241 |
| 2014 | $1,018 | $135,475 | $21,000 | $114,475 |
Source: Public Records
Map
Nearby Homes
- 755 Victory Grove Church Rd
- 1055 Fairway Ln
- 00 Smith Farm Rd
- 238 Victory Grove Church Rd
- 106 Saddletree Rd
- 1035 Timberlane Dr
- 101 Saddletree Rd
- 675 Heather Dr
- 170 Whitesides Dr
- 000 Southside Rd
- 109 Saddletree Rd
- 3347 & 3349 Gastonia Hwy
- 726 Lithia Inn Rd Unit 5
- 1811 Country Club Rd Unit 4
- 1809 Country Club Rd Unit 3
- 718 Lithia Inn Rd Unit 7
- 1807 Country Club Rd Unit 2
- 1803 Country Club Rd Unit 1
- 2319 Tin Mine Rd
- 140 Shields Dr
- 1525 Jessica Ann Rd
- 1553 Jessica Ann Rd
- 1524 Jessica Ann Rd
- 596 Victory Grove Church Rd
- 1544 Jessica Ann Rd
- 1569 Jessica Ann Rd
- 602 Victory Grove Church Rd
- 604 Victory Grove Church Rd
- 579 Victory Grove Church Rd
- 1568 Jessica Ann Rd
- 532 Victory Grove Church Rd
- 616 Victory Grove Church Rd
- 1581 Jessica Ann Rd
- 1582 Jessica Ann Rd
- 609 Victory Grove Church Rd
- 1595 Jessica Ann Rd
- 514 Victory Grove Church Rd
- 634 Victory Grove Church Rd
- 1596 Jessica Ann Rd
- 1609 Jessica Ann Rd