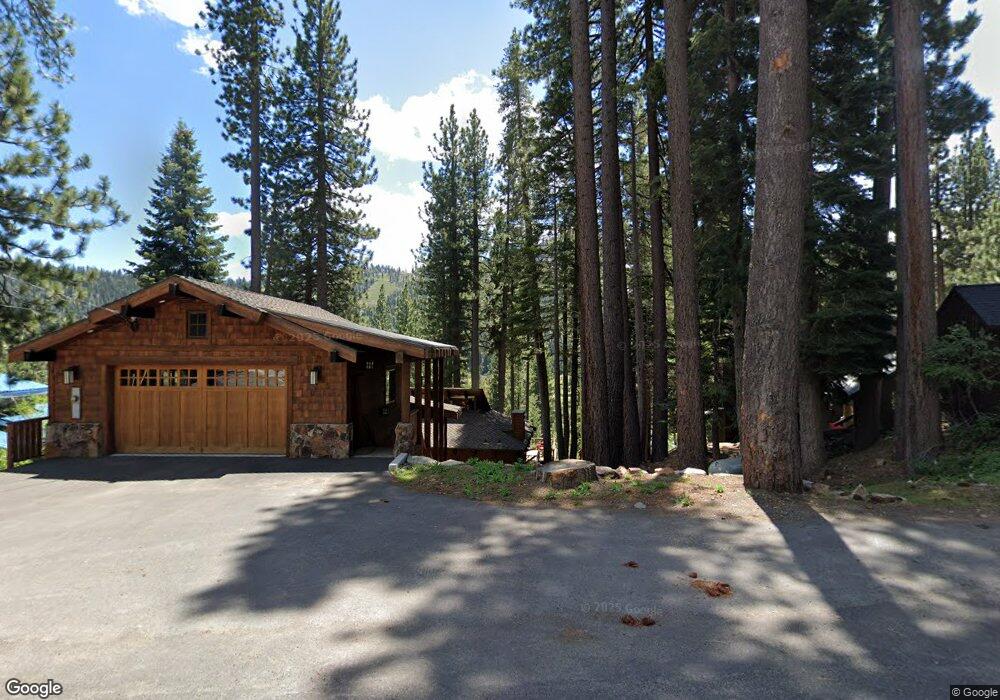
1539 Sandy Way Olympic Valley, CA 96146
Alpine Meadows NeighborhoodEstimated Value: $786,000 - $1,241,389
3
Beds
2
Baths
1,542
Sq Ft
$665/Sq Ft
Est. Value
About This Home
This home is located at 1539 Sandy Way, Olympic Valley, CA 96146 and is currently estimated at $1,026,097, approximately $665 per square foot. 1539 Sandy Way is a home with nearby schools including Tahoe Lake Elementary School, North Tahoe School, and North Tahoe High School.
Ownership History
Date
Name
Owned For
Owner Type
Purchase Details
Closed on
Sep 30, 2010
Sold by
Urban Christopher Anthony and Urban Cameron Mary
Bought by
Urban Robert Stanley and Urban Dana Abigail
Current Estimated Value
Purchase Details
Closed on
Sep 28, 2006
Sold by
Urban Cameron Mary and Urban Christopher Anthony
Bought by
Urban Christopher Anthony and Urban Cameron Mary
Purchase Details
Closed on
Nov 29, 2005
Sold by
Sweitzer John William
Bought by
Urban Christopher Anthony and Urban Cameron Mary
Purchase Details
Closed on
Dec 31, 2001
Sold by
Kahn Robert C and Kahn Sharon H
Bought by
Urban Dana Abigail and Urban Robert Stanley
Purchase Details
Closed on
Dec 26, 2001
Sold by
Kahn Robert C
Bought by
Kahn Robert C and Kahn Sharon H
Purchase Details
Closed on
Aug 1, 1967
Sold by
Kahn Robert C and Kahn Karen J
Bought by
Hawkins Daryl R and Hawkins Joyce
Create a Home Valuation Report for This Property
The Home Valuation Report is an in-depth analysis detailing your home's value as well as a comparison with similar homes in the area
Home Values in the Area
Average Home Value in this Area
Purchase History
| Date | Buyer | Sale Price | Title Company |
|---|---|---|---|
| Urban Robert Stanley | $300,000 | None Available | |
| Urban Christopher Anthony | -- | Multiple | |
| Urban Christopher Anthony | -- | Placer Title Company | |
| Urban Christopher Anthony | $445,000 | Multiple | |
| Hawkins Joyce | -- | Multiple | |
| Urban Dana Abigail | -- | -- | |
| Urban Cameron Mary | -- | -- | |
| Kahn Robert C | -- | -- | |
| Hawkins Daryl R | $16,500 | Placer Title Company |
Source: Public Records
Tax History Compared to Growth
Tax History
| Year | Tax Paid | Tax Assessment Tax Assessment Total Assessment is a certain percentage of the fair market value that is determined by local assessors to be the total taxable value of land and additions on the property. | Land | Improvement |
|---|---|---|---|---|
| 2025 | $8,295 | $738,600 | $317,605 | $420,995 |
| 2023 | $8,295 | $709,922 | $305,273 | $404,649 |
| 2022 | $8,012 | $696,003 | $299,288 | $396,715 |
| 2021 | $7,715 | $682,357 | $293,420 | $388,937 |
| 2020 | $7,169 | $623,110 | $290,412 | $332,698 |
| 2019 | $7,026 | $591,285 | $284,718 | $306,567 |
| 2018 | $6,539 | $579,692 | $279,136 | $300,556 |
| 2017 | $6,418 | $568,326 | $273,663 | $294,663 |
| 2016 | $6,355 | $557,184 | $268,298 | $288,886 |
| 2015 | $6,230 | $548,815 | $264,268 | $284,547 |
| 2014 | $6,051 | $538,066 | $259,092 | $278,974 |
Source: Public Records
Map
Nearby Homes
- 1542 Sandy Way
- 1560 Lanny Ln
- 1620 Lanny Ln
- 1449 Sandy Way
- 2000 Squaw Valley Rd
- 1591 Olympic Valley Rd Unit 29
- 1733 Christy Ln
- 1880 Apache Ct
- 980 Olympic Valley Rd
- 1750 Village Rd E Unit 5-417
- 1750 Village East Rd Unit 5-409
- 1850 Village South Rd Unit 417 (4-417)
- 1850 Village South Rd Unit 4-327
- 1985 Olympic Valley Rd Unit 2-312
- 1985 Olympic Valley Rd Unit 216 (2-216)
- 1985 Olympic Valley Rd Unit 2-419
- 1060 Sandy Way
- 1003 Lanny Ln
- 400 Resort Rd Unit 958
- 400 Resort Rd Unit 655
- 1549 Sandy Way
- 1529 Sandy Way
- 1532 Sandy Way
- 1552 Sandy Way
- 1559 Sandy Way
- 1519 Sandy Way
- 1522 Sandy Way
- 1540 Lanny Ln
- 1562 Sandy Way
- 1569 Sandy Way
- 1580 Lanny Ln
- 1512 Sandy Way
- 1572 Sandy Way
- 1509 Sandy Way
- 6187 Sandy Way
- East End Sandy Way
- 1520 Lanny Ln
- 1499 Sandy Way
- 1502 Sandy Way
- 1582 Sandy Way