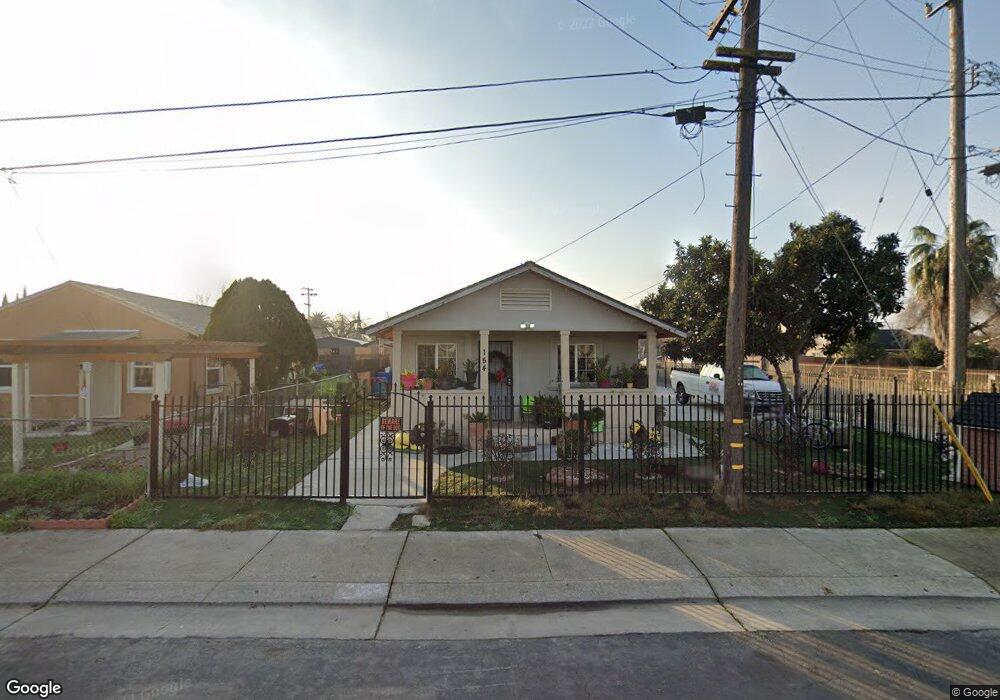
154 E 10th St Stockton, CA 95206
Seaport NeighborhoodEstimated Value: $292,000 - $304,000
3
Beds
1
Bath
880
Sq Ft
$338/Sq Ft
Est. Value
About This Home
This home is located at 154 E 10th St, Stockton, CA 95206 and is currently estimated at $297,839, approximately $338 per square foot. 154 E 10th St is a home located in San Joaquin County with nearby schools including McKinley Elementary School, Taft Elementary School, and Dolores Huerta Elementary School.
Ownership History
Date
Name
Owned For
Owner Type
Purchase Details
Closed on
Feb 7, 2018
Sold by
Trejo Leorcio and Trejo Gloria
Bought by
Popoca Juan M and Contreras Vanesa Bravo
Current Estimated Value
Home Financials for this Owner
Home Financials are based on the most recent Mortgage that was taken out on this home.
Original Mortgage
$156,000
Interest Rate
4.38%
Mortgage Type
New Conventional
Purchase Details
Closed on
Feb 8, 2012
Sold by
Kappos John M and Kappos Carol J
Bought by
Trejo Leoncio and Trejo Gloria
Home Financials for this Owner
Home Financials are based on the most recent Mortgage that was taken out on this home.
Original Mortgage
$37,500
Interest Rate
3.9%
Mortgage Type
New Conventional
Purchase Details
Closed on
May 23, 2008
Sold by
Kappos John
Bought by
Kappos John M and Kappos Carol J
Create a Home Valuation Report for This Property
The Home Valuation Report is an in-depth analysis detailing your home's value as well as a comparison with similar homes in the area
Home Values in the Area
Average Home Value in this Area
Purchase History
| Date | Buyer | Sale Price | Title Company |
|---|---|---|---|
| Popoca Juan M | $195,000 | First American Title Company | |
| Trejo Leoncio | $50,000 | Chicago Title Company | |
| Kappos John M | -- | None Available |
Source: Public Records
Mortgage History
| Date | Status | Borrower | Loan Amount |
|---|---|---|---|
| Previous Owner | Popoca Juan M | $156,000 | |
| Previous Owner | Trejo Leoncio | $37,500 |
Source: Public Records
Tax History Compared to Growth
Tax History
| Year | Tax Paid | Tax Assessment Tax Assessment Total Assessment is a certain percentage of the fair market value that is determined by local assessors to be the total taxable value of land and additions on the property. | Land | Improvement |
|---|---|---|---|---|
| 2025 | $2,757 | $221,871 | $56,889 | $164,982 |
| 2024 | $2,713 | $217,522 | $55,774 | $161,748 |
| 2023 | $2,652 | $213,258 | $54,681 | $158,577 |
| 2022 | $2,608 | $209,077 | $53,609 | $155,468 |
| 2021 | $2,506 | $204,978 | $52,558 | $152,420 |
| 2020 | $2,555 | $202,878 | $52,020 | $150,858 |
| 2019 | $2,545 | $198,900 | $51,000 | $147,900 |
| 2018 | $727 | $55,194 | $13,246 | $41,948 |
| 2017 | $690 | $54,113 | $12,987 | $41,126 |
| 2016 | $701 | $53,051 | $12,732 | $40,319 |
| 2015 | $701 | $52,255 | $12,541 | $39,714 |
| 2014 | $669 | $51,232 | $12,296 | $38,936 |
Source: Public Records
Map
Nearby Homes
- 2624 S Monroe St
- 174 Horton Ave
- 2332 S Madison St
- 2723 S Van Buren St
- 544 W 9th St
- 364 W 7th St
- 539 Buena Vida Ct
- 220 Delhi Ave
- 407 W 7th St
- 3504 French Camp Turnpike
- 421 E 8th St
- 314 Kolher St
- 426 Howard St
- 332 Kolher St
- 1932 S Lincoln St
- 1926 S San Joaquin St
- 2213 Peralta Ave
- 509 Howard St
- 2211 Peralta Ave
- 231 E 5th St
- 154 W 10th St
- 146 W 10th St
- 140 W 10th St
- 2494 S Madison St
- 2562 S Madison St
- 169 Mosswood Ave
- 134 W 10th St
- 137 E 10th St
- 203 Mosswood Ave
- 151 Mosswood Ave
- 2492 S Madison St
- 137 W 10th St
- 2547 S Madison St
- 129 W 10th St
- 2525 S Madison St
- 215 Mosswood Ave
- 141 Mosswood Ave
- 129 E 10th St
- 122 W 10th St
- 2490 S Madison St