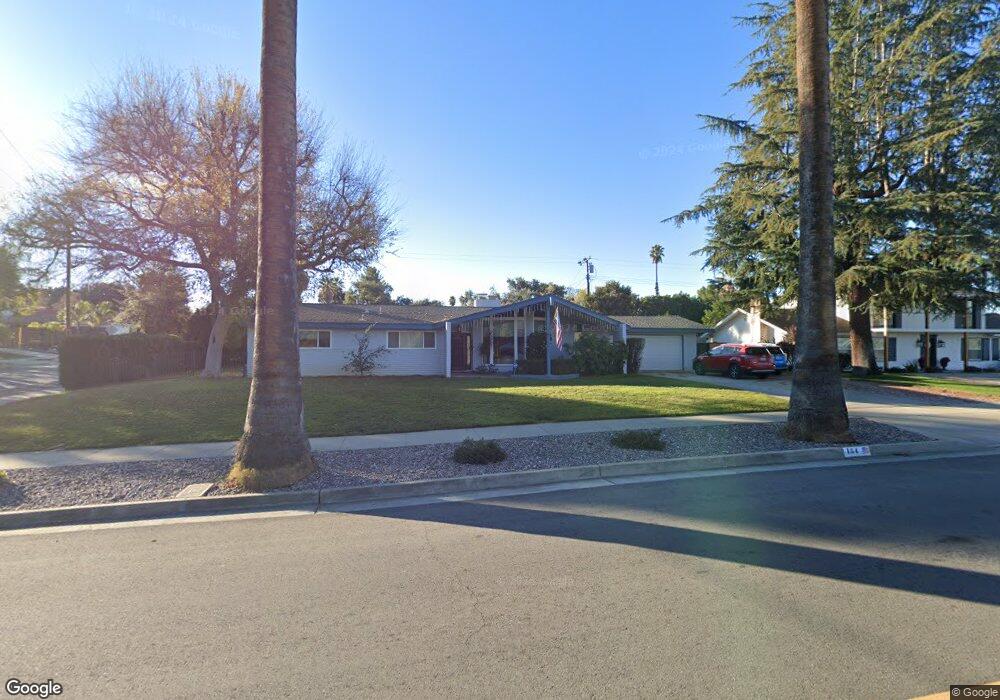
154 E Hilton Ave Redlands, CA 92373
South Redlands NeighborhoodEstimated Value: $675,000 - $785,000
3
Beds
2
Baths
1,667
Sq Ft
$435/Sq Ft
Est. Value
About This Home
This home is located at 154 E Hilton Ave, Redlands, CA 92373 and is currently estimated at $725,825, approximately $435 per square foot. 154 E Hilton Ave is a home located in San Bernardino County with nearby schools including Kimberly Elementary School, Moore Middle School, and Redlands Senior High School.
Ownership History
Date
Name
Owned For
Owner Type
Purchase Details
Closed on
Jan 10, 2001
Sold by
Moynihan James A and Moynihan Karen L
Bought by
Moynihan James A and Moynihan Karen L
Current Estimated Value
Purchase Details
Closed on
Jan 6, 1999
Sold by
Breeden Ronald D and Breeden Joanne E
Bought by
Moynihan James A and Moynihan Karen L
Home Financials for this Owner
Home Financials are based on the most recent Mortgage that was taken out on this home.
Original Mortgage
$180,500
Outstanding Balance
$41,902
Interest Rate
6.77%
Estimated Equity
$683,923
Purchase Details
Closed on
Jul 25, 1995
Sold by
Sutherland Stuart James and Sutherland Deborah Jean
Bought by
Breeden Ronald D and Breeden Joanne E
Home Financials for this Owner
Home Financials are based on the most recent Mortgage that was taken out on this home.
Original Mortgage
$153,900
Interest Rate
7.71%
Create a Home Valuation Report for This Property
The Home Valuation Report is an in-depth analysis detailing your home's value as well as a comparison with similar homes in the area
Home Values in the Area
Average Home Value in this Area
Purchase History
| Date | Buyer | Sale Price | Title Company |
|---|---|---|---|
| Moynihan James A | -- | -- | |
| Moynihan James A | $190,000 | Orange Coast Title | |
| Breeden Ronald D | $171,000 | Stewart Title Company |
Source: Public Records
Mortgage History
| Date | Status | Borrower | Loan Amount |
|---|---|---|---|
| Open | Moynihan James A | $180,500 | |
| Previous Owner | Breeden Ronald D | $153,900 |
Source: Public Records
Tax History
| Year | Tax Paid | Tax Assessment Tax Assessment Total Assessment is a certain percentage of the fair market value that is determined by local assessors to be the total taxable value of land and additions on the property. | Land | Improvement |
|---|---|---|---|---|
| 2025 | $3,636 | $297,866 | $47,031 | $250,835 |
| 2024 | $3,394 | $292,026 | $46,109 | $245,917 |
| 2023 | $3,388 | $286,300 | $45,205 | $241,095 |
| 2022 | $3,338 | $280,687 | $44,319 | $236,368 |
| 2021 | $3,397 | $275,183 | $43,450 | $231,733 |
| 2020 | $3,346 | $272,361 | $43,004 | $229,357 |
| 2019 | $3,251 | $267,021 | $42,161 | $224,860 |
| 2018 | $3,168 | $261,785 | $41,334 | $220,451 |
| 2017 | $3,140 | $256,652 | $40,524 | $216,128 |
| 2016 | $3,103 | $251,619 | $39,729 | $211,890 |
| 2015 | $3,079 | $247,839 | $39,132 | $208,707 |
| 2014 | $3,022 | $242,984 | $38,365 | $204,619 |
Source: Public Records
Map
Nearby Homes
- 225 Sunset Dr
- 1370 Oak St
- 1514 Franklin Ave
- 1525 Garden St
- 1388 Brandon Ct
- 116 Franklin Ave
- 1617 Garden St
- 1641 Ford St
- 512 Golden West Dr
- 0 Garden St Unit EV23054640
- 505 E Sunset Dr N
- 0 Campbell Ave
- 1631 Benita Marie Crest
- 261 E Crescent Ave
- 1550 Marion Rd
- 533 Via Vista Dr
- 1377 Knoll Rd
- 1400 Elizabeth St
- 1702 Dwight St
- 412 Phlox Ct
- 152 E Hilton Ave
- 141 Anita Ct
- 909 Franklin Ave
- 202 E Sunset Dr N
- 139 Anita Ct
- 151 E Hilton Ave
- 150 E Hilton Ave
- 201 Anita Ct
- 137 Anita Ct
- 206 E Sunset Dr N
- 382 Cynthia Crescent
- 205 E Sunset Dr N
- 149 E Hilton Ave
- 205 Anita Ct
- 148 E Hilton Ave
- 378 Franklin Ave
- 140 Anita Ct
- 135 Anita Ct
- 138 Anita Ct
- 210 E Sunset Dr N
Your Personal Tour Guide
Ask me questions while you tour the home.