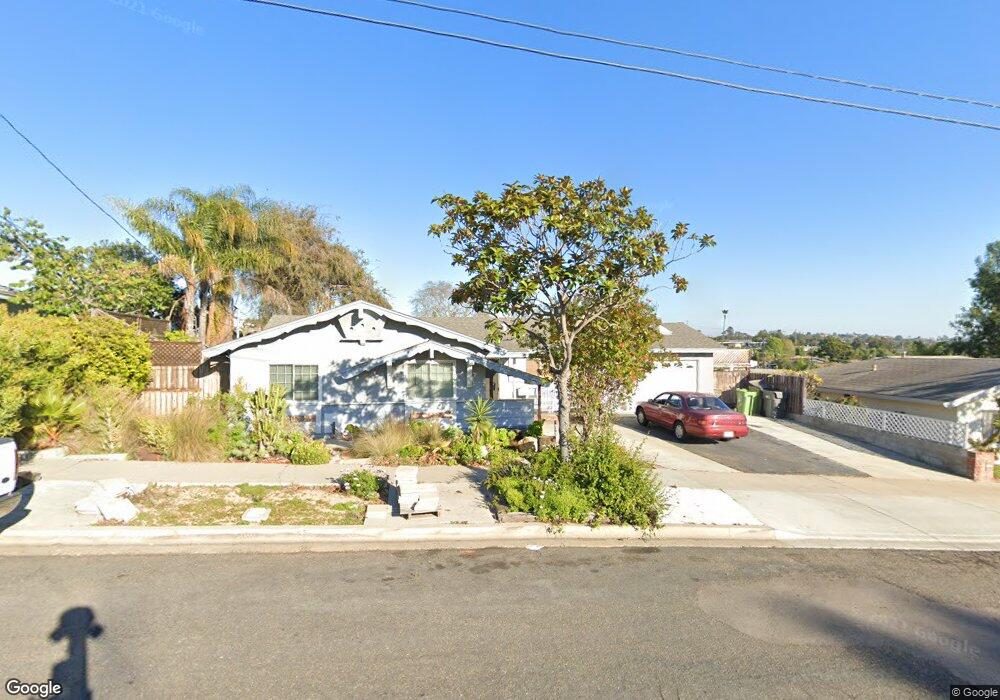
154 Libby St Oceanside, CA 92054
Loma Alta NeighborhoodEstimated Value: $769,000 - $843,000
3
Beds
2
Baths
1,176
Sq Ft
$676/Sq Ft
Est. Value
About This Home
This home is located at 154 Libby St, Oceanside, CA 92054 and is currently estimated at $794,553, approximately $675 per square foot. 154 Libby St is a home located in San Diego County with nearby schools including Mission Elementary School, Oceanside High School, and Oceanside Adventist Elementary School.
Ownership History
Date
Name
Owned For
Owner Type
Purchase Details
Closed on
May 9, 2022
Sold by
Adams Patrick R
Bought by
Adams Patrick R and May Mary C
Current Estimated Value
Purchase Details
Closed on
May 10, 2005
Sold by
Adams Patrick R
Bought by
Adams Patrick R
Create a Home Valuation Report for This Property
The Home Valuation Report is an in-depth analysis detailing your home's value as well as a comparison with similar homes in the area
Home Values in the Area
Average Home Value in this Area
Purchase History
| Date | Buyer | Sale Price | Title Company |
|---|---|---|---|
| Adams Patrick R | -- | None Listed On Document | |
| Adams Patrick R | -- | -- |
Source: Public Records
Tax History
| Year | Tax Paid | Tax Assessment Tax Assessment Total Assessment is a certain percentage of the fair market value that is determined by local assessors to be the total taxable value of land and additions on the property. | Land | Improvement |
|---|---|---|---|---|
| 2025 | $603 | $57,462 | $19,603 | $37,859 |
| 2024 | $603 | $56,336 | $19,219 | $37,117 |
| 2023 | $583 | $55,233 | $18,843 | $36,390 |
| 2022 | $572 | $54,151 | $18,474 | $35,677 |
| 2021 | $573 | $53,090 | $18,112 | $34,978 |
| 2020 | $556 | $52,547 | $17,927 | $34,620 |
| 2019 | $539 | $51,518 | $17,576 | $33,942 |
| 2018 | $532 | $50,509 | $17,232 | $33,277 |
| 2017 | $521 | $49,520 | $16,895 | $32,625 |
| 2016 | $502 | $48,550 | $16,564 | $31,986 |
| 2015 | $488 | $47,822 | $16,316 | $31,506 |
| 2014 | $470 | $46,886 | $15,997 | $30,889 |
Source: Public Records
Map
Nearby Homes
- 168 Carey Rd
- 0 Amick St Unit 146-100-23-00, 21, 1
- 506 Canyon Dr Unit 6
- 2721 Lomita St
- 310 Isthmus Way Unit 17
- 2861 Turnbull St
- 415 Stoney Point Way Unit 106
- 420 Stoney Point Way Unit 113
- 430 Stoney Point Way Unit 129
- 430 Stoney Point Way Unit 124
- 230 Hoover St
- 2904 E Barnwell St
- 1432 Buena St
- 2937 E Barnwell St
- 1328 Buena St
- 1330 Bush St
- 503 505 N Nevada St
- 722 &718 N Freeman St
- 509 Rockledge St
- 426 Grant St
Your Personal Tour Guide
Ask me questions while you tour the home.