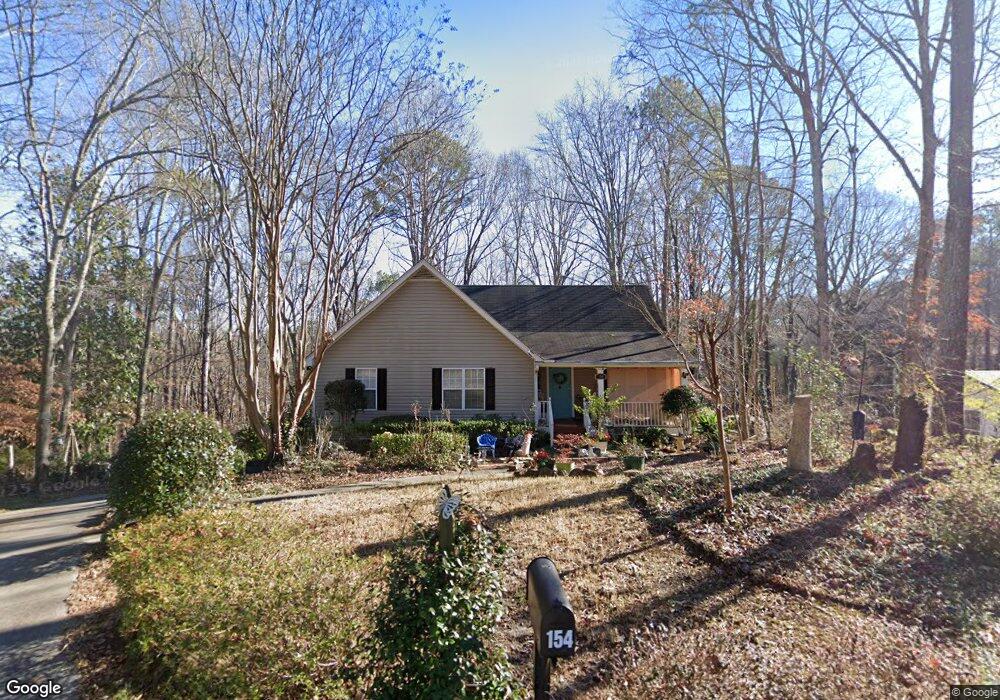
154 Tilson Rd Athens, GA 30606
Berkley Hills NeighborhoodEstimated Value: $343,000 - $430,000
--
Bed
--
Bath
2,229
Sq Ft
$166/Sq Ft
Est. Value
About This Home
This home is located at 154 Tilson Rd, Athens, GA 30606 and is currently estimated at $369,754, approximately $165 per square foot. 154 Tilson Rd is a home located in Clarke County with nearby schools including Timothy Elementary School, Clarke Middle School, and Clarke Central High School.
Ownership History
Date
Name
Owned For
Owner Type
Purchase Details
Closed on
Apr 9, 2009
Sold by
Parcon Rochedahl C
Bought by
Parcon Vincente S
Current Estimated Value
Home Financials for this Owner
Home Financials are based on the most recent Mortgage that was taken out on this home.
Original Mortgage
$87,000
Interest Rate
4.69%
Mortgage Type
New Conventional
Purchase Details
Closed on
Jul 19, 2002
Sold by
Prime Homes Inc
Bought by
Parcon Rochedahl C
Purchase Details
Closed on
Sep 10, 2001
Sold by
Anlock Development Corporation
Bought by
Prime Homes Inc
Purchase Details
Closed on
Mar 15, 1999
Sold by
Athens Area Habitat For Humanity Inc
Bought by
Anlock Development Corporation
Purchase Details
Closed on
Dec 28, 1996
Sold by
Mcrae Barbara
Bought by
Athens Area Habitat For Humanity Inc
Purchase Details
Closed on
Mar 23, 1994
Sold by
Mcrae Matthew and Claudette Shea
Bought by
Mcrae Barbara
Create a Home Valuation Report for This Property
The Home Valuation Report is an in-depth analysis detailing your home's value as well as a comparison with similar homes in the area
Home Values in the Area
Average Home Value in this Area
Purchase History
| Date | Buyer | Sale Price | Title Company |
|---|---|---|---|
| Parcon Vincente S | -- | -- | |
| Parcon Rochedahl C | $136,500 | -- | |
| Prime Homes Inc | $9,500 | -- | |
| Anlock Development Corporation | $9,000 | -- | |
| Athens Area Habitat For Humanity Inc | -- | -- | |
| Mcrae Barbara | -- | -- |
Source: Public Records
Mortgage History
| Date | Status | Borrower | Loan Amount |
|---|---|---|---|
| Closed | Parcon Vincente S | $87,000 |
Source: Public Records
Tax History Compared to Growth
Tax History
| Year | Tax Paid | Tax Assessment Tax Assessment Total Assessment is a certain percentage of the fair market value that is determined by local assessors to be the total taxable value of land and additions on the property. | Land | Improvement |
|---|---|---|---|---|
| 2025 | $3,152 | $119,382 | $12,000 | $107,382 |
| 2024 | $3,152 | $114,441 | $12,000 | $102,441 |
| 2023 | $3,077 | $108,228 | $12,000 | $96,228 |
| 2022 | $2,504 | $88,508 | $10,400 | $78,108 |
| 2021 | $2,209 | $75,539 | $10,400 | $65,139 |
| 2020 | $2,015 | $69,796 | $10,400 | $59,396 |
| 2019 | $1,973 | $68,112 | $8,000 | $60,112 |
| 2018 | $1,547 | $55,578 | $8,000 | $47,578 |
| 2017 | $1,366 | $50,225 | $8,000 | $42,225 |
| 2016 | $1,192 | $45,098 | $8,000 | $37,098 |
| 2015 | $1,197 | $45,205 | $8,000 | $37,205 |
| 2014 | $1,181 | $44,667 | $8,000 | $36,667 |
Source: Public Records
Map
Nearby Homes
- 262 Rhodes Dr
- 299 Kennington Dr
- 213 Highpointe Ln
- 277 Highpointe Ln
- 145 Holmes Ave
- 105 Princeton Mill Rd
- 105 Greystone Terrace
- 780 Macon Hwy
- 185 Eaglewood Way
- 190 Bowles Dr Unit 1
- 190 Bowles Dr
- 253 Sleepy Creek Dr
- 200 Cheatham Dr
- 205 Heritage Stroll
- 3119 Spartan Estates Dr
- 145 Heatherwood Ln
- 595 Macon Hwy
- 595 Macon Hwy Unit 9
- 148 Tilson Rd
- 0 Tilson Rd Unit CM373690
- 9 & 11 Tilson Rd
- 0 Tilson Rd Unit CM413772
- 0 Tilson Rd Unit CM462470
- 0 Tilson Rd Unit 8013755
- 0 Tilson Rd Unit 7327591
- 0 Tilson Rd Unit 3112354
- 0 Tilson Rd Unit 9049634
- 0 Tilson Rd Unit 8882560
- 160 Tilson Rd
- 155 Tilson Rd
- 165 Tilson Rd
- 142 Tilson Rd
- 166 Tilson Rd Unit 13
- 166 Tilson Rd
- 145 Tilson Rd
- 169 Tilson Rd
- 243 Holmes Ave
- 136 Tilson Rd