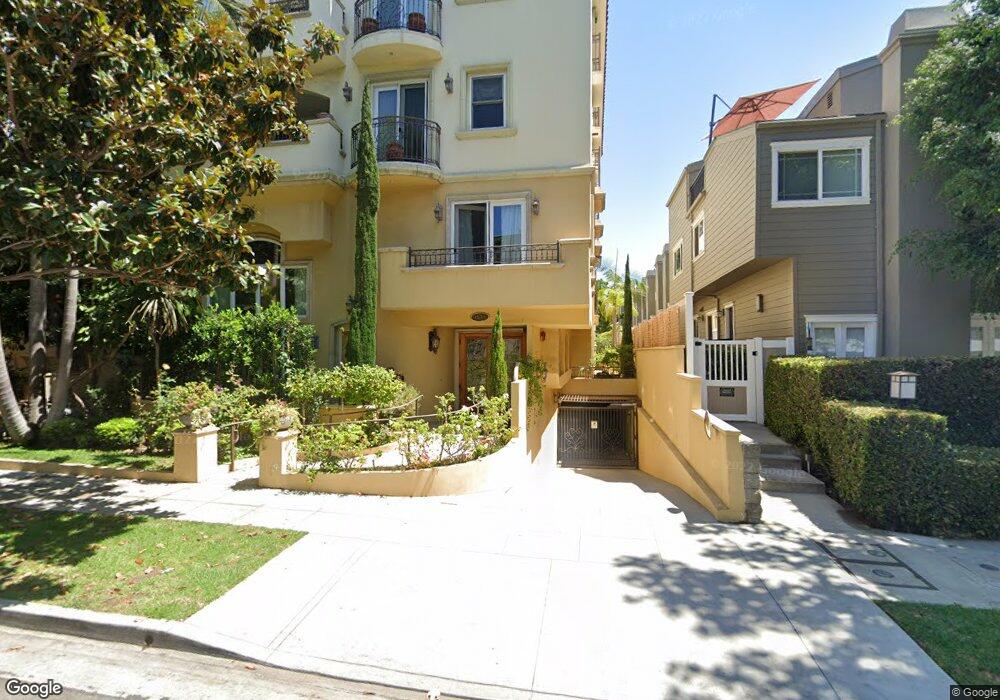
1540 S Bentley Ave Unit 103 Los Angeles, CA 90025
Westwood NeighborhoodEstimated Value: $1,220,000 - $1,537,000
3
Beds
3
Baths
1,785
Sq Ft
$744/Sq Ft
Est. Value
About This Home
This home is located at 1540 S Bentley Ave Unit 103, Los Angeles, CA 90025 and is currently estimated at $1,328,539, approximately $744 per square foot. 1540 S Bentley Ave Unit 103 is a home located in Los Angeles County with nearby schools including Nora Sterry Elementary School, Fairburn Avenue Elementary, and Westwood Charter School.
Ownership History
Date
Name
Owned For
Owner Type
Purchase Details
Closed on
May 21, 2018
Sold by
Muthyala Ramana Babu
Bought by
Muthyala Ramana Babu and Inamdar Madhuri
Current Estimated Value
Purchase Details
Closed on
Aug 17, 2009
Sold by
The Bentley Llc
Bought by
Muthyala Ramana B
Home Financials for this Owner
Home Financials are based on the most recent Mortgage that was taken out on this home.
Original Mortgage
$704,800
Interest Rate
5.3%
Mortgage Type
Purchase Money Mortgage
Purchase Details
Closed on
Mar 1, 1999
Sold by
Yadegar Joseph and Yadegar Naomi
Bought by
The Bentley Llc
Purchase Details
Closed on
Dec 1, 1998
Sold by
Meigs Robert Finley and Meigs Mary Mcbryan
Bought by
Yadegar Joseph and Yadegar Naomi
Home Financials for this Owner
Home Financials are based on the most recent Mortgage that was taken out on this home.
Original Mortgage
$414,000
Interest Rate
2.95%
Create a Home Valuation Report for This Property
The Home Valuation Report is an in-depth analysis detailing your home's value as well as a comparison with similar homes in the area
Home Values in the Area
Average Home Value in this Area
Purchase History
| Date | Buyer | Sale Price | Title Company |
|---|---|---|---|
| Muthyala Ramana Babu | -- | None Available | |
| Muthyala Ramana B | -- | Lawyers Title | |
| The Bentley Llc | -- | Provident Title | |
| Yadegar Joseph | $552,000 | Equity Title |
Source: Public Records
Mortgage History
| Date | Status | Borrower | Loan Amount |
|---|---|---|---|
| Closed | Muthyala Ramana B | $704,800 | |
| Previous Owner | Yadegar Joseph | $414,000 |
Source: Public Records
Tax History Compared to Growth
Tax History
| Year | Tax Paid | Tax Assessment Tax Assessment Total Assessment is a certain percentage of the fair market value that is determined by local assessors to be the total taxable value of land and additions on the property. | Land | Improvement |
|---|---|---|---|---|
| 2025 | $13,551 | $1,137,202 | $560,855 | $576,347 |
| 2024 | $13,551 | $1,114,905 | $549,858 | $565,047 |
| 2023 | $13,290 | $1,093,045 | $539,077 | $553,968 |
| 2022 | $12,668 | $1,071,613 | $528,507 | $543,106 |
| 2021 | $12,510 | $1,050,602 | $518,145 | $532,457 |
| 2019 | $12,132 | $1,019,443 | $502,778 | $516,665 |
| 2018 | $12,099 | $999,455 | $492,920 | $506,535 |
| 2016 | $11,571 | $960,646 | $473,780 | $486,866 |
| 2015 | $11,317 | $946,217 | $466,664 | $479,553 |
| 2014 | $11,352 | $927,683 | $457,523 | $470,160 |
Source: Public Records
Map
Nearby Homes
- 1540 S Bentley Ave Unit 402
- 1520 Camden Ave Unit 103
- 1530 Camden Ave Unit PH3
- 1500 Camden Ave Unit 3E
- 1431 Camden Ave Unit 303
- 1601 S Bentley Ave Unit 201
- 1427 S Bentley Ave Unit D
- 1521 Greenfield Ave Unit 104
- 1421 Greenfield Ave
- 1401 S Bentley Ave Unit 203
- 1401 S Bentley Ave Unit 202
- 1630 S Bentley Ave Unit 103
- 1630 S Bentley Ave Unit 202
- 1401 Camden Ave Unit 2
- 1615 Greenfield Ave
- 1434 Greenfield Ave Unit 303
- 1633 S Bentley Ave Unit 306
- 1633 S Bentley Ave Unit 103
- 1655 Greenfield Ave Unit 3
- 1655 Greenfield Ave Unit 16
- 1540 S Bentley Ave
- 1540 S Bentley Ave Unit 102
- 1540 S Bentley Ave Unit 302
- 1540 S Bentley Ave Unit 301
- 1540 S Bentley Ave Unit 101
- 1540 S Bentley Ave Unit 401
- 1532 S Bentley Ave
- 11033 Massachusetts Ave Unit 16
- 11033 Massachusetts Ave Unit 26
- 11033 Massachusetts Ave Unit 25
- 11033 Massachusetts Ave Unit 24
- 11033 Massachusetts Ave Unit 22
- 11033 Massachusetts Ave Unit 20
- 11033 Massachusetts Ave Unit 19
- 11033 Massachusetts Ave Unit 18
- 11033 Massachusetts Ave Unit 17
- 11033 Massachusetts Ave Unit 15
- 11033 Massachusetts Ave Unit 14
- 11033 Massachusetts Ave Unit 21
- 11033 Massachusetts Ave Unit 13